
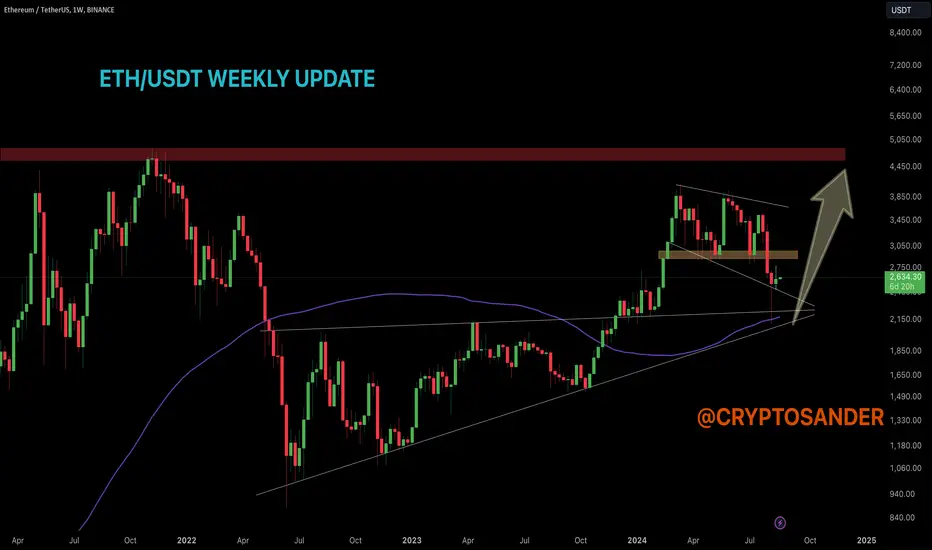
ETH/USDT is currently testing key resistance levels within the descending channel. A breakout above $3,050 could lead to a retest of higher resistance areas around $3,850. The 100MA near $2,150 has provided strong support, and the price needs to be above this level to maintain the bullish momentum. Traders should keep an eye on volume confirmation and price action near these crucial levels.
This update provides a concise analysis of the ETH/USDT weekly chart, focusing on key support and resistance levels, moving averages, chart patterns, and volume considerations.
Remember: This is not financial advice. Stay tuned to us for further updates and analysis. Thank you!
This update provides a concise analysis of the ETH/USDT weekly chart, focusing on key support and resistance levels, moving averages, chart patterns, and volume considerations.
Remember: This is not financial advice. Stay tuned to us for further updates and analysis. Thank you!

相關出版品
免責聲明
這些資訊和出版物並非旨在提供,也不構成TradingView提供或認可的任何形式的財務、投資、交易或其他類型的建議或推薦。請閱讀使用條款以了解更多資訊。