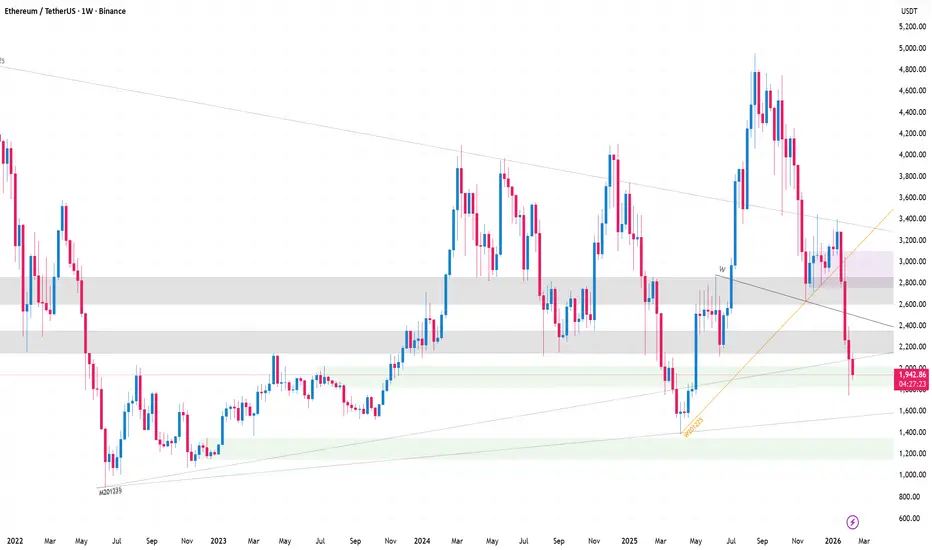

 ETHUSDT Weekly Breakdown: Bearish Structure Points Toward
Current Structure (Weekly)
Major High ~4,800–5,000
Clear distribution at the top.
Lower high formed after rejection.
Market Structure Shift
Strong bearish impulse from 4.8k → 2k.
Broke previous weekly higher lows.
That confirms HTF bearish shift.
Current Price ~2,000
Sitting near previous weekly demand.
But momentum candles are still bearish.
Volume spike on the recent drop = aggressive selling.
Bearish Scenario (Higher Probability Now)
Logic:
Lower High formed.
Strong displacement down.
No bullish BOS yet on weekly.
If 1,950–2,000 fails cleanly:
➡️ Next target: 1,600–1,700 (previous weekly liquidity pool)
➡️ Below that: 1,200–1,300 major demand
This is the logical draw on liquidity.
Bullish Scenario (Only If Structure Shifts)
To turn bullish:
Weekly close back above 2,600–2,700
Then break of 3,200 with strong volume
Only then we can target:
➡️ 3,800
➡️ 4,500+
Short-term: Possible small bounce from 2k zone.
Mid-term: Higher probability of sweep toward 1,600 liquidity before real reversal.
GOOD LUCK
TRADING BITE

免責聲明
這些資訊和出版物並非旨在提供,也不構成TradingView提供或認可的任何形式的財務、投資、交易或其他類型的建議或推薦。請閱讀使用條款以了解更多資訊。
免責聲明
這些資訊和出版物並非旨在提供,也不構成TradingView提供或認可的任何形式的財務、投資、交易或其他類型的建議或推薦。請閱讀使用條款以了解更多資訊。