

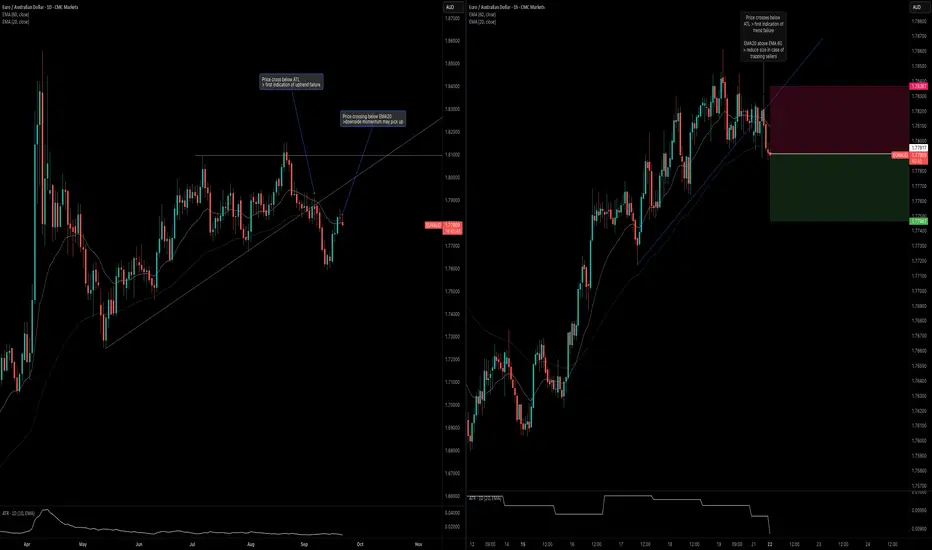
Not my conventional signal as this one is looking to trade in the opposite of the trend.
Daily Timeframe:
H1 Timeframe:
Daily Timeframe:
- EMA20 is barely below EMA60 > downside momentum might pick up
- Price is barely crossing below EMA20 > another indication of downside momentum
- Price crossed below ATL, pulled back, and now seems to be continuing lower
H1 Timeframe:
- Price crosses below ATL > first indication of uptrend failing to continue
- Note that EMA20 is above EMA60 still > there is a risk that this will trap sellers

免責聲明
這些資訊和出版物並非旨在提供,也不構成TradingView提供或認可的任何形式的財務、投資、交易或其他類型的建議或推薦。請閱讀使用條款以了解更多資訊。
免責聲明
這些資訊和出版物並非旨在提供,也不構成TradingView提供或認可的任何形式的財務、投資、交易或其他類型的建議或推薦。請閱讀使用條款以了解更多資訊。