

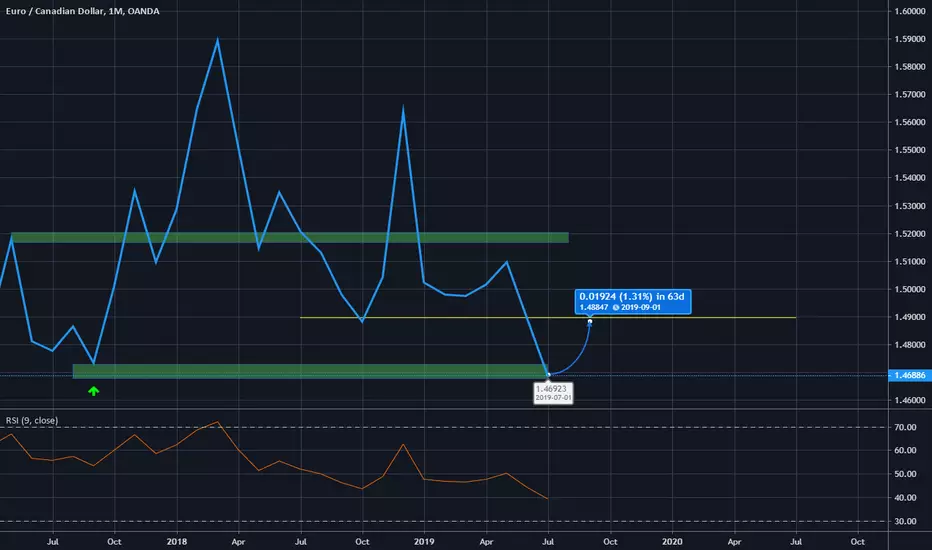
The Support Level is hard to see on the daily and even weekly chart, but it does exist! This is a monthly support level!
so.....
1. Daily Chart Came Down To Monthly Support and moved up , and then CAME DOWN again and RETESTED the Montly Support Area!
2. Indicators on hour 4 indicate a buy now!
So the Idea is that we are have entered a buy on the daily chart at a monthly support area and we ENTERED our trade on hour 4 to confirm this buy!
I hope this helps!
so.....
1. Daily Chart Came Down To Monthly Support and moved up , and then CAME DOWN again and RETESTED the Montly Support Area!
2. Indicators on hour 4 indicate a buy now!
So the Idea is that we are have entered a buy on the daily chart at a monthly support area and we ENTERED our trade on hour 4 to confirm this buy!
I hope this helps!

免責聲明
這些資訊和出版物並非旨在提供,也不構成TradingView提供或認可的任何形式的財務、投資、交易或其他類型的建議或推薦。請閱讀使用條款以了解更多資訊。
免責聲明
這些資訊和出版物並非旨在提供,也不構成TradingView提供或認可的任何形式的財務、投資、交易或其他類型的建議或推薦。請閱讀使用條款以了解更多資訊。