

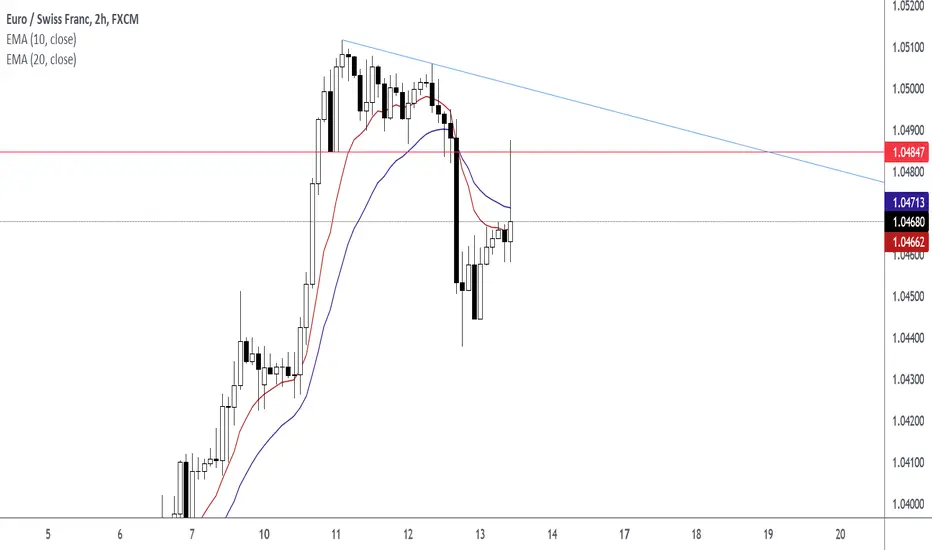
IF price closes below horizontal level, trend level, ema 10 level, and ema 20 level, THEN watch for sell opportunities.
In this chart, you will see price closed below all four levels. This close of the candle is convincing that a drop in price is imminent.

After the close, draw your trend line connecting the lower highs.


Wait for the retest of horizontal level in the form of a price action signal. In this case, a pin bar form. The candlestick wick intersects the EMA 10, EMA 20, and Horizontal Level.

Candlestick wick intersects Fibonacci Retracement Levels 0.618 and 0.500.

In this chart, you will see price closed below all four levels. This close of the candle is convincing that a drop in price is imminent.
After the close, draw your trend line connecting the lower highs.
Wait for the retest of horizontal level in the form of a price action signal. In this case, a pin bar form. The candlestick wick intersects the EMA 10, EMA 20, and Horizontal Level.
Candlestick wick intersects Fibonacci Retracement Levels 0.618 and 0.500.
註釋
Reward:Risk RatioFixed Stop Loss At 10.0 Pips
Stop Loss At EMA 20 Level

免責聲明
這些資訊和出版物並非旨在提供,也不構成TradingView提供或認可的任何形式的財務、投資、交易或其他類型的建議或推薦。請閱讀使用條款以了解更多資訊。
免責聲明
這些資訊和出版物並非旨在提供,也不構成TradingView提供或認可的任何形式的財務、投資、交易或其他類型的建議或推薦。請閱讀使用條款以了解更多資訊。