

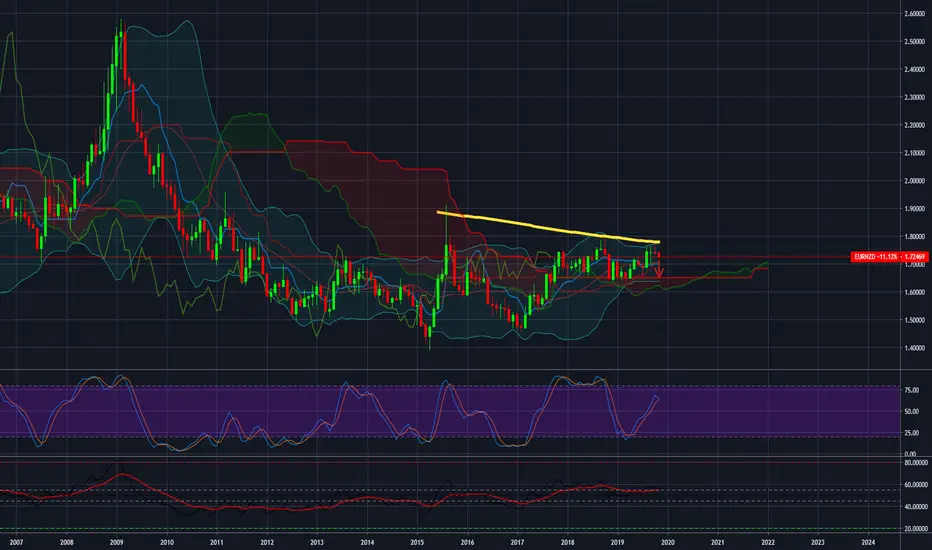
We usually prefer to analyze graphs in D1 but this pattern in the monthly graph forces us to write about it.
2 Doji candlestick symbolizing a trend ending (to confirm the current candle theory should close in red ... got off to a good start)
The 200 moving average line synchronizes with the resistance line at 1.7760.
This is the third time eurnzd has touched the average line and is responding to declines.
Target: 1.7110
2 Doji candlestick symbolizing a trend ending (to confirm the current candle theory should close in red ... got off to a good start)
The 200 moving average line synchronizes with the resistance line at 1.7760.
This is the third time eurnzd has touched the average line and is responding to declines.
Target: 1.7110

免責聲明
這些資訊和出版物並非旨在提供,也不構成TradingView提供或認可的任何形式的財務、投資、交易或其他類型的建議或推薦。請閱讀使用條款以了解更多資訊。