

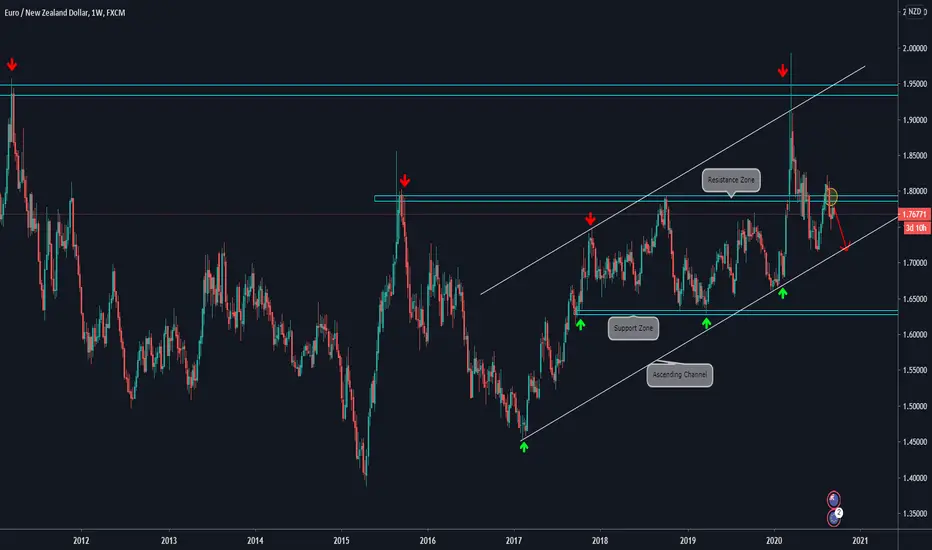
🔸WEEKLY CHART EXPLANATION:
.
.
🔸Price bounced at the Confluence Zone between the Ascending Channel and the Resistance Zone.
.
🔸It did a strong downside move breaking the Support Zone (now Resistance Zone).
.
🔸It has retested the zone again and we observe that was a strong rejection there. We consider that it has potential to reach the Ascending Trendline
.
🔸 Will look for a lower timeframe bearish setup.
🔸 DAILY CHART ANALYSIS:

.
.
🔸Price bounced at the Confluence Zone between the Ascending Channel and the Resistance Zone.
.
🔸It did a strong downside move breaking the Support Zone (now Resistance Zone).
.
🔸It has retested the zone again and we observe that was a strong rejection there. We consider that it has potential to reach the Ascending Trendline
.
🔸 Will look for a lower timeframe bearish setup.
🔸 DAILY CHART ANALYSIS:

免責聲明
這些資訊和出版物並非旨在提供,也不構成TradingView提供或認可的任何形式的財務、投資、交易或其他類型的建議或推薦。請閱讀使用條款以了解更多資訊。
免責聲明
這些資訊和出版物並非旨在提供,也不構成TradingView提供或認可的任何形式的財務、投資、交易或其他類型的建議或推薦。請閱讀使用條款以了解更多資訊。