

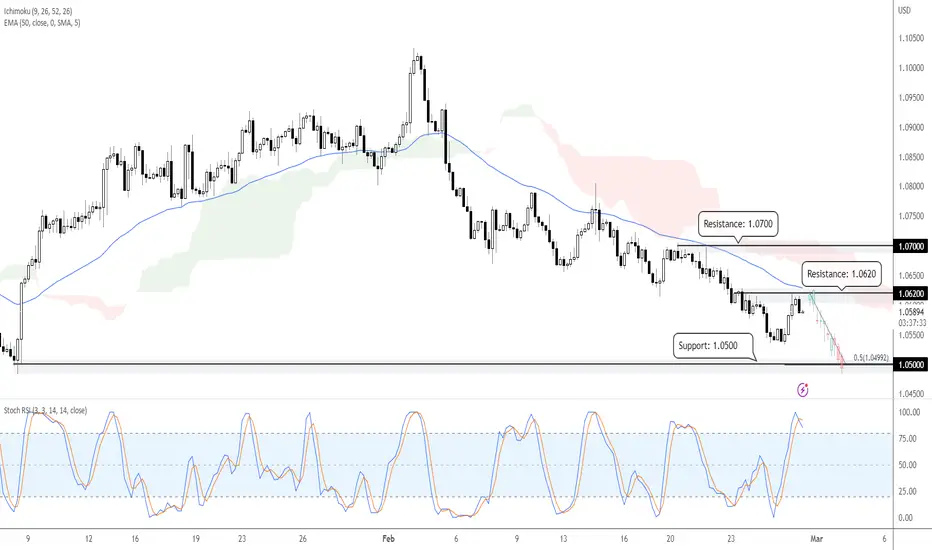
On the H4 timeframe, prices are showing bearish order flow with lower lows and lower highs formed. A pullback to the resistance zone at 1.0620 could present an opportunity to play the drop to the next support zone at 1.0500, in line with the graphical low and 50% Fibonacci extension. Prices are holding below the Ichimoku cloud and 50 EMA, while Stochastic RSI is in the overbought region above 80, supporting our bearish bias.

免責聲明
這些資訊和出版物並非旨在提供,也不構成TradingView提供或認可的任何形式的財務、投資、交易或其他類型的建議或推薦。請閱讀使用條款以了解更多資訊。
免責聲明
這些資訊和出版物並非旨在提供,也不構成TradingView提供或認可的任何形式的財務、投資、交易或其他類型的建議或推薦。請閱讀使用條款以了解更多資訊。