

Hi guys,
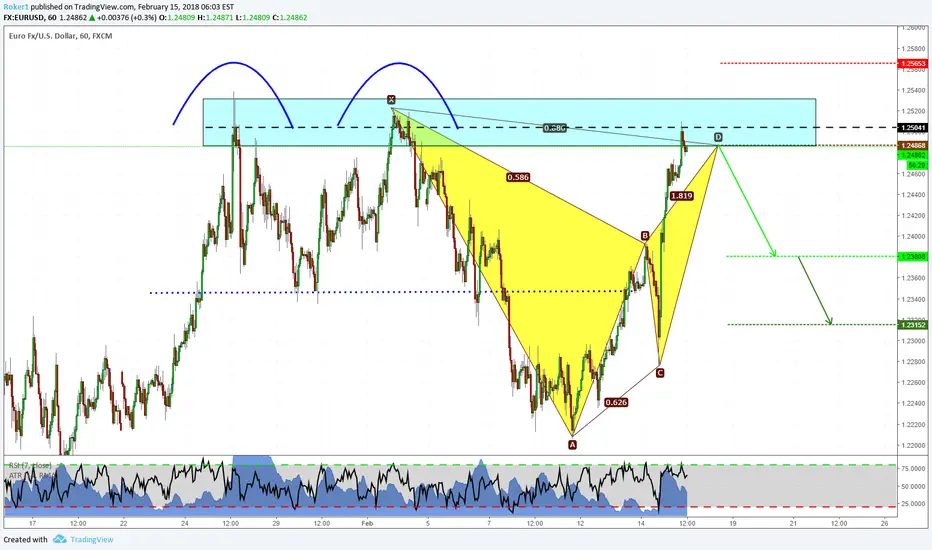
very simple setup. On EURUSD we've recently created a double top on the daily chart and price has broken to the downside, giving us reason to believe it's headed lower (RSI divergence is also supporting that). Although the price has increased very rapidly over the last hours, i'm still incline to sell this market and i've also found a valid entry point, that is the D point of the Bat pattern that's on the lower timeframe (4H and 1H). Sold at the D point, with stops above X and targets as shown on the chart.
If you have any idea/question, feel free to comment below.
Otherwise, see you in the next chart!
very simple setup. On EURUSD we've recently created a double top on the daily chart and price has broken to the downside, giving us reason to believe it's headed lower (RSI divergence is also supporting that). Although the price has increased very rapidly over the last hours, i'm still incline to sell this market and i've also found a valid entry point, that is the D point of the Bat pattern that's on the lower timeframe (4H and 1H). Sold at the D point, with stops above X and targets as shown on the chart.
If you have any idea/question, feel free to comment below.
Otherwise, see you in the next chart!
註釋
Targets moved with Fibonacci. New targets:交易結束:目標達成
First target hit!交易結束:目標達成
Second target hit!
免責聲明
這些資訊和出版物並非旨在提供,也不構成TradingView提供或認可的任何形式的財務、投資、交易或其他類型的建議或推薦。請閱讀使用條款以了解更多資訊。