

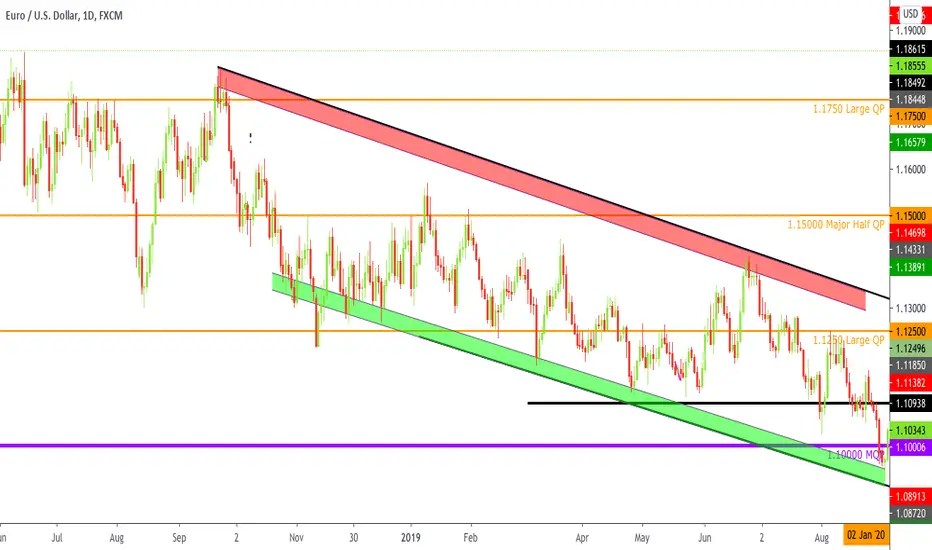
The above chart shows what is called a “channel” in trading. It is basically diagonal support and resistance (a.k.a Trend-lines). The area in between is known as a channel.
The red zone is said to be the perfect entry area for sells whereas the green is for buys.
How To Find The Zones?
Using the “Parallel Lines” tool, draw the diagonal S/R then measure the first candle/wick that starts the channel and that area is where you would get entries with the least possible drawdown.
The red zone is said to be the perfect entry area for sells whereas the green is for buys.
How To Find The Zones?
Using the “Parallel Lines” tool, draw the diagonal S/R then measure the first candle/wick that starts the channel and that area is where you would get entries with the least possible drawdown.

免責聲明
這些資訊和出版物並非旨在提供,也不構成TradingView提供或認可的任何形式的財務、投資、交易或其他類型的建議或推薦。請閱讀使用條款以了解更多資訊。
免責聲明
這些資訊和出版物並非旨在提供,也不構成TradingView提供或認可的任何形式的財務、投資、交易或其他類型的建議或推薦。請閱讀使用條款以了解更多資訊。