

Buongiorno a tutti,
Il grande Jesse Livermore disse: TRADA QUELLO CHE VEDI E NON QUELLO CHE PENSI.
Breve aggiornamento sullo stato dei fatti.
Se vi piace il mio metodo di analisi, lasciate un like e seguite il profilo, è molto importante per me, grazie!
EurUsd
TF settimanale.
Struttura interna rialzista.
La candela mostra un grande corpo con 125 pips di escursione massima e chiusura sui minimi: c'è stata forte pressione ribassista.
Chiusura nei pressi della EMA 20.
Il prezzo è attratto dalla zona settimanale e soprattutto dal lato inferiore del triangolo simmetrico.
Fibo 0.50 rotto.

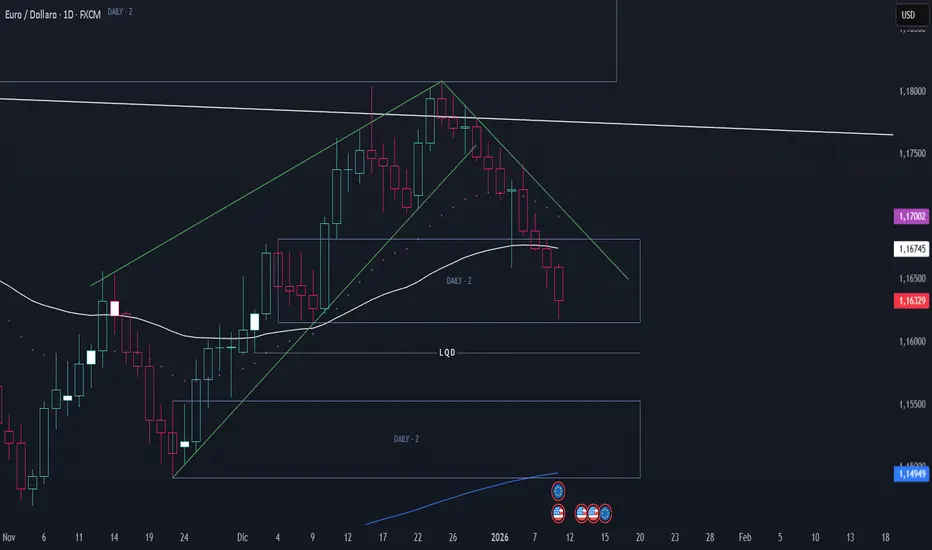
TF giornaliero.
Struttura interna ribassista.
Discesa dai massimi circa 190 pips.
Da tenere d'occhio il comportamento del prezzo in questa zona giornaliera che al momento si trova ben sotto la EMA 50.

A partire da lunedì, presi i minimi della zona giornaliera (vedere anche candela inside poco sotto non ancora mitigata con minimo a 1.1592), potremmo aspettarci un ritracciamento in area 1.1700 per poi proseguire verso area 1.1550.
Personalmente prenderò posizione quando il prezzo si troverà in livelli più liquidi. Più precisamente: long se avverrà un deciso cambio di struttura interna in H4, per sfruttare il rimbalzo dopo questa buona discesa.
Uno sguardo al DXY.

Restate sintonizzati, seguiranno aggiornamenti!
A presto
Mind Primacy
Disclaimer: tutte le analisi esposte attraverso questo profilo non rappresentano consigli finanziari, ma la mia personale visione basata sulle strategie operative di trading che utilizzo.
_____________________________________________________________________________
English
Hello everyone,
The great Jesse Livermore once said: TRADE WHAT YOU SEE, NOT WHAT YOU THINK.
Quick update on the current market status.
If you appreciate my analysis method, please leave a like and follow my profile—it means a lot to me. Thank you!
EURUSD
Weekly Timeframe.
Bullish internal structure.
Price Action: The weekly candle shows a large body with a 125-pip range, closing near the lows, signaling strong bearish pressure.
Key Levels: Price closed near the 20 EMA.
Outlook: Price is being drawn toward the weekly zone and, more importantly, toward the lower boundary of the symmetrical triangle.
Fibonacci: The 0.50 level has been broken.
Daily Timeframe
Bearish internal structure.
Performance: A drop of approximately 190 pips from the recent highs.
Key Levels: We need to monitor price behavior in this daily zone, as it is currently trading well below the 50 EMA.
Trading Plan
Starting Monday, once the lows of the daily zone are taken (keep an eye on the unmitigated inside candle just below with a low at 1.1592), we could expect a retracement toward the 1.1700 area before a continuation move down to the 1.1550 area.
My Strategy: I will personally look for an entry once price reaches higher liquidity levels. Specifically: long position only if we see a decisive internal structure shift on the H4 timeframe, to capitalize on a bounce following this significant move down.
Stay tuned for further updates!
See you soon,
Mind Primacy
Disclaimer: All analyses shared on this profile do not represent financial advice; they reflect my personal view based on my specific trading strategies.
Il grande Jesse Livermore disse: TRADA QUELLO CHE VEDI E NON QUELLO CHE PENSI.
Breve aggiornamento sullo stato dei fatti.
Se vi piace il mio metodo di analisi, lasciate un like e seguite il profilo, è molto importante per me, grazie!
EurUsd
TF settimanale.
Struttura interna rialzista.
La candela mostra un grande corpo con 125 pips di escursione massima e chiusura sui minimi: c'è stata forte pressione ribassista.
Chiusura nei pressi della EMA 20.
Il prezzo è attratto dalla zona settimanale e soprattutto dal lato inferiore del triangolo simmetrico.
Fibo 0.50 rotto.
TF giornaliero.
Struttura interna ribassista.
Discesa dai massimi circa 190 pips.
Da tenere d'occhio il comportamento del prezzo in questa zona giornaliera che al momento si trova ben sotto la EMA 50.
A partire da lunedì, presi i minimi della zona giornaliera (vedere anche candela inside poco sotto non ancora mitigata con minimo a 1.1592), potremmo aspettarci un ritracciamento in area 1.1700 per poi proseguire verso area 1.1550.
Personalmente prenderò posizione quando il prezzo si troverà in livelli più liquidi. Più precisamente: long se avverrà un deciso cambio di struttura interna in H4, per sfruttare il rimbalzo dopo questa buona discesa.
Uno sguardo al DXY.
Restate sintonizzati, seguiranno aggiornamenti!
A presto
Mind Primacy
Disclaimer: tutte le analisi esposte attraverso questo profilo non rappresentano consigli finanziari, ma la mia personale visione basata sulle strategie operative di trading che utilizzo.
_____________________________________________________________________________
English
Hello everyone,
The great Jesse Livermore once said: TRADE WHAT YOU SEE, NOT WHAT YOU THINK.
Quick update on the current market status.
If you appreciate my analysis method, please leave a like and follow my profile—it means a lot to me. Thank you!
EURUSD
Weekly Timeframe.
Bullish internal structure.
Price Action: The weekly candle shows a large body with a 125-pip range, closing near the lows, signaling strong bearish pressure.
Key Levels: Price closed near the 20 EMA.
Outlook: Price is being drawn toward the weekly zone and, more importantly, toward the lower boundary of the symmetrical triangle.
Fibonacci: The 0.50 level has been broken.
Daily Timeframe
Bearish internal structure.
Performance: A drop of approximately 190 pips from the recent highs.
Key Levels: We need to monitor price behavior in this daily zone, as it is currently trading well below the 50 EMA.
Trading Plan
Starting Monday, once the lows of the daily zone are taken (keep an eye on the unmitigated inside candle just below with a low at 1.1592), we could expect a retracement toward the 1.1700 area before a continuation move down to the 1.1550 area.
My Strategy: I will personally look for an entry once price reaches higher liquidity levels. Specifically: long position only if we see a decisive internal structure shift on the H4 timeframe, to capitalize on a bounce following this significant move down.
Stay tuned for further updates!
See you soon,
Mind Primacy
Disclaimer: All analyses shared on this profile do not represent financial advice; they reflect my personal view based on my specific trading strategies.
取消訂單
Le chiare manipolazioni in seguito alle notizie (dazi, Groenlandia, ecc.) hanno prodotto movimenti di prezzo esagerati. Non ho preso posizioni, né long, né short. Resto in attesa di segnali più chiari.
La consapevolezza sui mercati.
Telegram: t.me/genisysswinglab
Sito web: genisysfx.com/
Telegram: t.me/genisysswinglab
Sito web: genisysfx.com/
相關出版品
免責聲明
這些資訊和出版物並非旨在提供,也不構成TradingView提供或認可的任何形式的財務、投資、交易或其他類型的建議或推薦。請閱讀使用條款以了解更多資訊。
La consapevolezza sui mercati.
Telegram: t.me/genisysswinglab
Sito web: genisysfx.com/
Telegram: t.me/genisysswinglab
Sito web: genisysfx.com/
相關出版品
免責聲明
這些資訊和出版物並非旨在提供,也不構成TradingView提供或認可的任何形式的財務、投資、交易或其他類型的建議或推薦。請閱讀使用條款以了解更多資訊。