

Hello, traders!
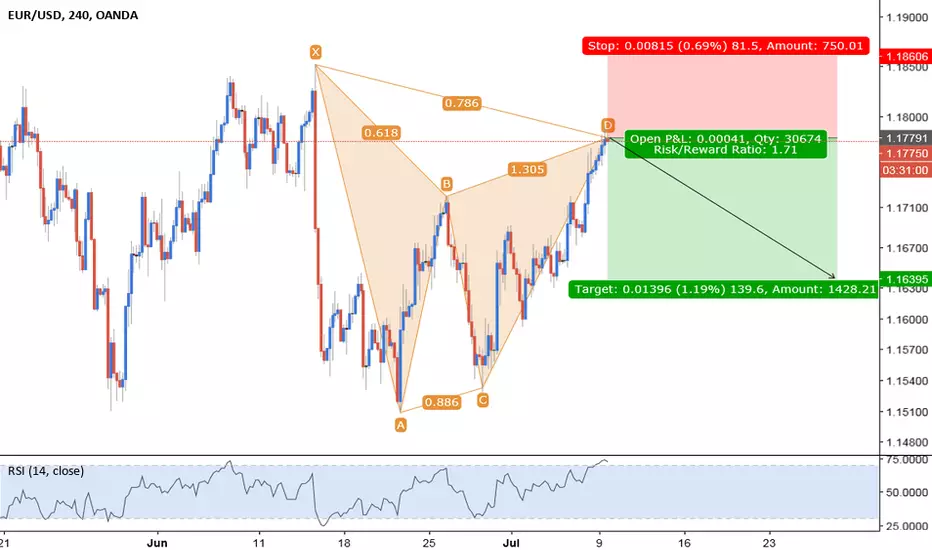
Today, we are looking at a Bearish Gartley Pattern on the 4H chart with EUR/USD.
Price seems to be stalling out with the RSI confirming price has been over bought.
Let me know what you all think!
The measurements for a valid Gartley Pattern are detailed below:
B: 0.618
C: 0.382 - 0.886
D: 1.272 - 1.618
Final X to D: 0.786
Today, we are looking at a Bearish Gartley Pattern on the 4H chart with EUR/USD.
Price seems to be stalling out with the RSI confirming price has been over bought.
Let me know what you all think!
The measurements for a valid Gartley Pattern are detailed below:
B: 0.618
C: 0.382 - 0.886
D: 1.272 - 1.618
Final X to D: 0.786

免責聲明
這些資訊和出版物並非旨在提供,也不構成TradingView提供或認可的任何形式的財務、投資、交易或其他類型的建議或推薦。請閱讀使用條款以了解更多資訊。
免責聲明
這些資訊和出版物並非旨在提供,也不構成TradingView提供或認可的任何形式的財務、投資、交易或其他類型的建議或推薦。請閱讀使用條款以了解更多資訊。