

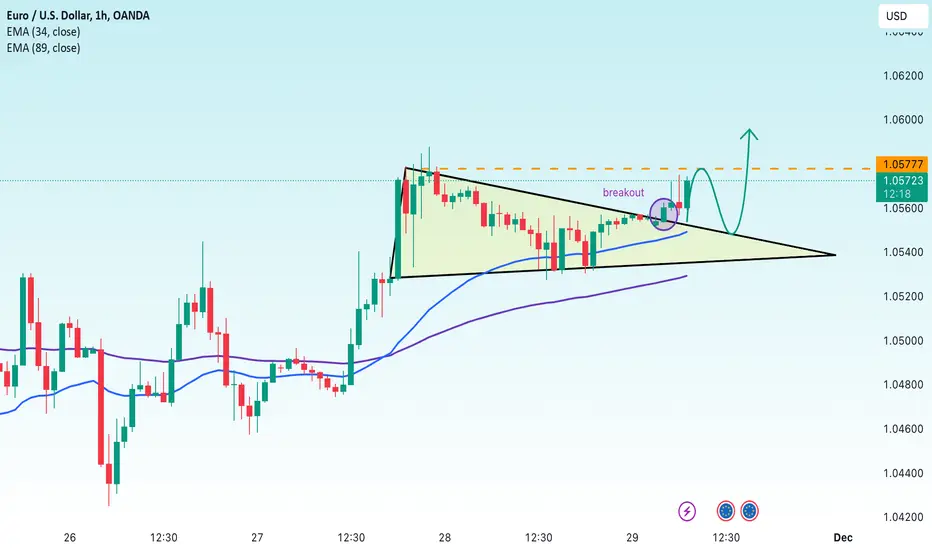
The EUR/USD 1-hour chart shows a triangle pattern forming, which is a sign of accumulation before a breakout. A breakout of this pattern to the upside, as it has recently done, could signal that the next bullish trend is likely to continue.
The price has broken above the EMA 34 and is approaching the EMA 89, which suggests that the bullish trend may be increasing. If the price sustains above the EMA 89 and continues to break above the previously drawn horizontal resistance around 1.0577, we can expect a significant upside move.
Personally, I would advise traders to closely monitor the price interaction with the EMA 89 and the resistance at 1.0577 in the coming hours to determine a suitable trading strategy. At the same time, it is indispensable to follow economic news that may affect EUR/USD to get a comprehensive view of the current market trend.
The price has broken above the EMA 34 and is approaching the EMA 89, which suggests that the bullish trend may be increasing. If the price sustains above the EMA 89 and continues to break above the previously drawn horizontal resistance around 1.0577, we can expect a significant upside move.
Personally, I would advise traders to closely monitor the price interaction with the EMA 89 and the resistance at 1.0577 in the coming hours to determine a suitable trading strategy. At the same time, it is indispensable to follow economic news that may affect EUR/USD to get a comprehensive view of the current market trend.

相關出版品
免責聲明
這些資訊和出版物並非旨在提供,也不構成TradingView提供或認可的任何形式的財務、投資、交易或其他類型的建議或推薦。請閱讀使用條款以了解更多資訊。