

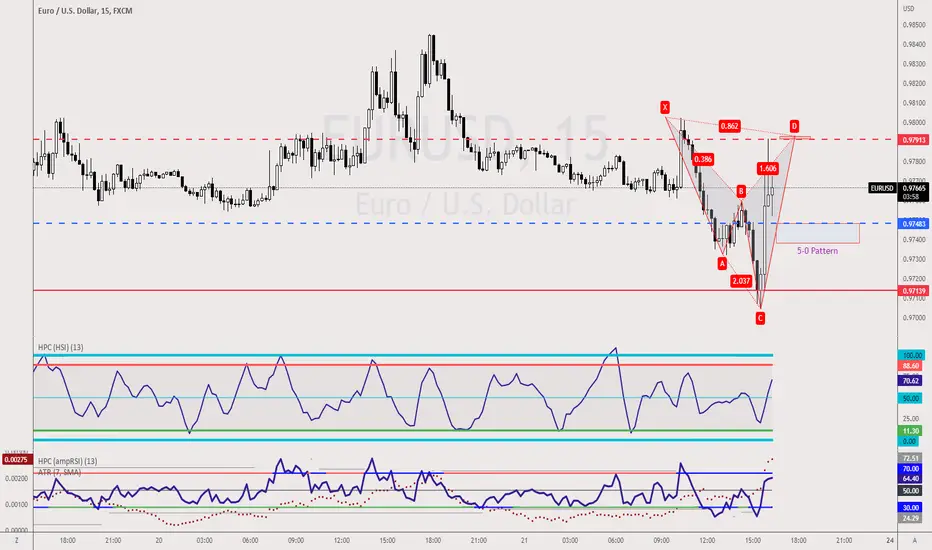
Well, if you guys are aware, I do not usually post an analysis based on M15 timeframe, but this setup is worth watching. The distance between the red and blue line is 43pips, substantial profit between the 2 levels.
On the red dotted line, come the completion of the Bearish Shark Pattern and the blue dotted line, Bullish 5-0 Pattern.
Candlestick Pattern confirmation is required before one consider it as an trading ideas.
p/s do your own analysis and never follow blindly
On the red dotted line, come the completion of the Bearish Shark Pattern and the blue dotted line, Bullish 5-0 Pattern.
Candlestick Pattern confirmation is required before one consider it as an trading ideas.
p/s do your own analysis and never follow blindly

🧑🏫Analysis now at Substack
🕒 Work 15mins to earn additional income
🏦 Qualify Financial Analyst within 90days
🎤 Keynote Speaker
🧠 21yrs in trading
🚀 Get into our Discord to receive our live market analysis!
discord.gg/AKDr9vPqH7
🕒 Work 15mins to earn additional income
🏦 Qualify Financial Analyst within 90days
🎤 Keynote Speaker
🧠 21yrs in trading
🚀 Get into our Discord to receive our live market analysis!
discord.gg/AKDr9vPqH7
免責聲明
這些資訊和出版物並非旨在提供,也不構成TradingView提供或認可的任何形式的財務、投資、交易或其他類型的建議或推薦。請閱讀使用條款以了解更多資訊。
🧑🏫Analysis now at Substack
🕒 Work 15mins to earn additional income
🏦 Qualify Financial Analyst within 90days
🎤 Keynote Speaker
🧠 21yrs in trading
🚀 Get into our Discord to receive our live market analysis!
discord.gg/AKDr9vPqH7
🕒 Work 15mins to earn additional income
🏦 Qualify Financial Analyst within 90days
🎤 Keynote Speaker
🧠 21yrs in trading
🚀 Get into our Discord to receive our live market analysis!
discord.gg/AKDr9vPqH7
免責聲明
這些資訊和出版物並非旨在提供,也不構成TradingView提供或認可的任何形式的財務、投資、交易或其他類型的建議或推薦。請閱讀使用條款以了解更多資訊。