

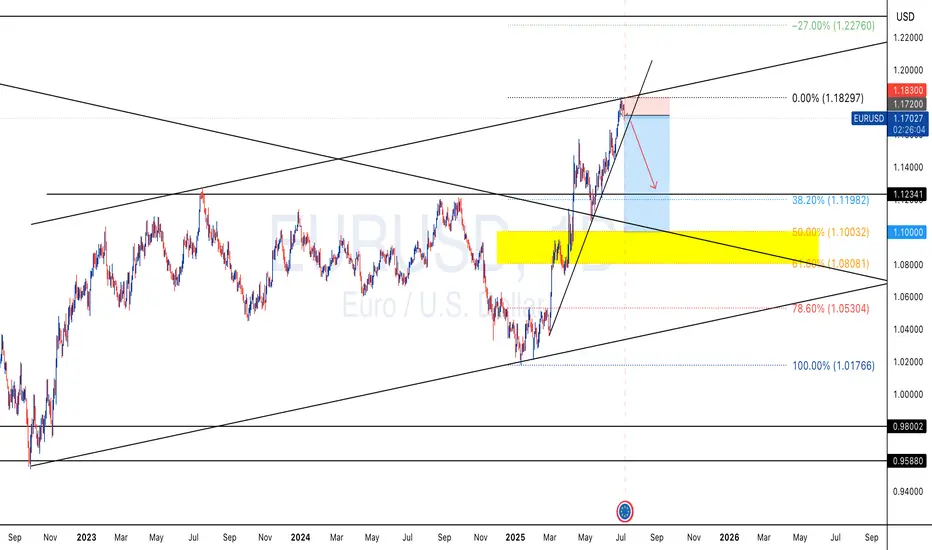
The daily EUR/USD chart shows a clear rejection at the 1.1830 resistance, aligned with the 0% Fibonacci level, following a sustained upward move. The rejection candlestick pattern, combined with the formation of an ascending channel, suggests buyer exhaustion and a potential start of a correction.
Fibonacci projections indicate key support zones at 1.1198 (38.2%), 1.1000 (50%), and 1.0800 (61.8%). A sustained break below the ascending trendline and the intermediate support zone (highlighted in yellow) would reinforce the correction scenario, with a potential target at 1.0176 (100% Fibonacci).
Decreasing volume and the lack of new significant highs further support the reversal hypothesis. Momentum analysis (RSI and MACD, if present) should be monitored for additional confirmation of the weakening bullish trend.
From a fundamental perspective, the correction may be triggered by divergences in ECB and Fed monetary policies, as well as recent macroeconomic data favoring the US dollar.
EUR/USD is showing clear technical signs of reversal after rejection at a key resistance. Loss of the 1.10 and 1.08 supports could accelerate the correction toward 1.0176. Close monitoring of upcoming candles and momentum indicators is recommended for confirmation of the move.
Fibonacci projections indicate key support zones at 1.1198 (38.2%), 1.1000 (50%), and 1.0800 (61.8%). A sustained break below the ascending trendline and the intermediate support zone (highlighted in yellow) would reinforce the correction scenario, with a potential target at 1.0176 (100% Fibonacci).
Decreasing volume and the lack of new significant highs further support the reversal hypothesis. Momentum analysis (RSI and MACD, if present) should be monitored for additional confirmation of the weakening bullish trend.
From a fundamental perspective, the correction may be triggered by divergences in ECB and Fed monetary policies, as well as recent macroeconomic data favoring the US dollar.
EUR/USD is showing clear technical signs of reversal after rejection at a key resistance. Loss of the 1.10 and 1.08 supports could accelerate the correction toward 1.0176. Close monitoring of upcoming candles and momentum indicators is recommended for confirmation of the move.

免責聲明
這些資訊和出版物並非旨在提供,也不構成TradingView提供或認可的任何形式的財務、投資、交易或其他類型的建議或推薦。請閱讀使用條款以了解更多資訊。
免責聲明
這些資訊和出版物並非旨在提供,也不構成TradingView提供或認可的任何形式的財務、投資、交易或其他類型的建議或推薦。請閱讀使用條款以了解更多資訊。