

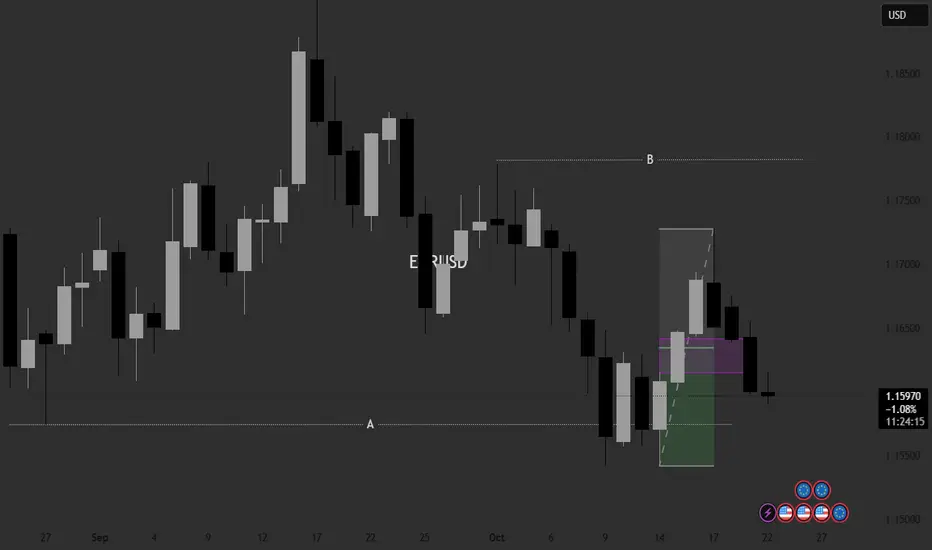
The price is reacting to the weekly key level and is forming a daily range with new structural zones. On the daily chart, we can see a break of the D FVG, which indicates the strength of the sellers. However, the price is moving into discount areas, which by themselves are zones of buyers’ interest. The key factor will be the daily candle close — if it closes above the 0.5 level of the range, it will indicate that the range has been balanced, and we can start considering long positions.
交易進行
If the price on the 4-hour chart stabilizes above the marked level, thereby forming an SNR, it will be possible to consider trades for updating the range.

免責聲明
這些資訊和出版物並非旨在提供,也不構成TradingView提供或認可的任何形式的財務、投資、交易或其他類型的建議或推薦。請閱讀使用條款以了解更多資訊。
免責聲明
這些資訊和出版物並非旨在提供,也不構成TradingView提供或認可的任何形式的財務、投資、交易或其他類型的建議或推薦。請閱讀使用條款以了解更多資訊。