
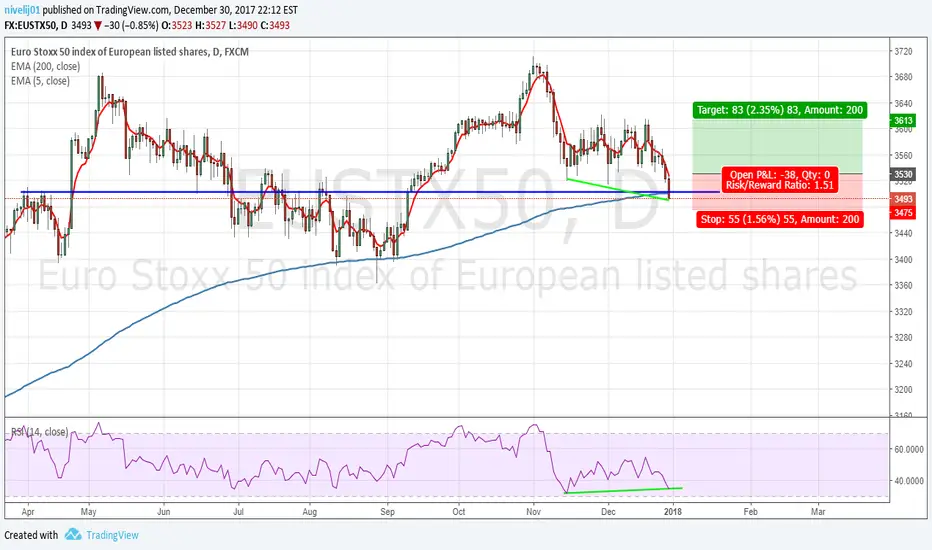
I can see a potential Long setup for EUSTX50 index. Couple of things that I observed:
1. Price is currently retesting EMA(200) and this is also a resistance-turned-support zone (back in April 2017).
2. A divergence observed between the chart and RSI(14), as chart is making lower low, whereas RSI(14) is making higher low.
If price can close around 3530 (which I roughly calculate should be when it close above EMA(50)), then I may open a Long position. Otherwise, no trade on this index.
1. Price is currently retesting EMA(200) and this is also a resistance-turned-support zone (back in April 2017).
2. A divergence observed between the chart and RSI(14), as chart is making lower low, whereas RSI(14) is making higher low.
If price can close around 3530 (which I roughly calculate should be when it close above EMA(50)), then I may open a Long position. Otherwise, no trade on this index.
註釋
Typo, it's EMA(5), not EMA(50)手動結束交易
Closed the trade with profit for now.
免責聲明
這些資訊和出版物並非旨在提供,也不構成TradingView提供或認可的任何形式的財務、投資、交易或其他類型的建議或推薦。請閱讀使用條款以了解更多資訊。