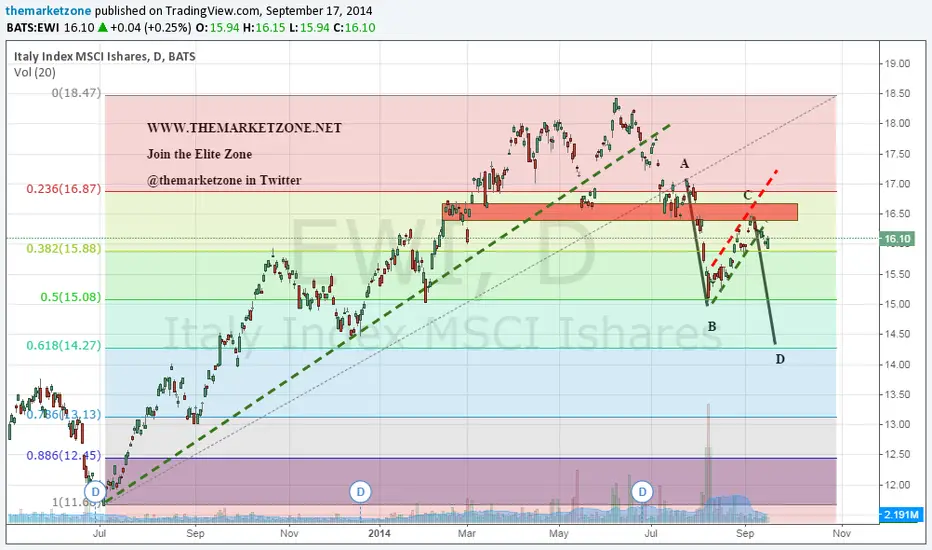
In June, Italy broke below the downtrend line its been following since mid 2013.
After a sharp decline where it broke also below the 16.5 support zone, EWI used the last couple of week to made a small pullback (in a form of a bearish Flag) right back into the 16.5 zone (now resistance).
Since C point (16.5) was right at the 61.8 Fib level, we may see a possible bullish AB=CD pattern which will be complete near 14$. If that's the case, we are talking about another sharp decline coming real soon.
We already saw the first bearish signal as the ETF broke below the bear Flag pattern and it seems like that the only thing that can prevent Italy from completing the pattern is another "pump" from the Fed or the ECB.
16.5 is the critical level to watch. A close above it will violate this analysis.
After a sharp decline where it broke also below the 16.5 support zone,
EWI used the last couple of week to made a small pullback (in a form of a bearish Flag) right back into the 16.5 zone (now resistance).Since C point (16.5) was right at the 61.8 Fib level, we may see a possible bullish AB=CD pattern which will be complete near 14$. If that's the case, we are talking about another sharp decline coming real soon.
We already saw the first bearish signal as the ETF broke below the bear Flag pattern and it seems like that the only thing that can prevent Italy from completing the pattern is another "pump" from the Fed or the ECB.
16.5 is the critical level to watch. A close above it will violate this analysis.

免責聲明
這些資訊和出版物並非旨在提供,也不構成TradingView提供或認可的任何形式的財務、投資、交易或其他類型的建議或推薦。請閱讀使用條款以了解更多資訊。
免責聲明
這些資訊和出版物並非旨在提供,也不構成TradingView提供或認可的任何形式的財務、投資、交易或其他類型的建議或推薦。請閱讀使用條款以了解更多資訊。