做多
ExideInd1!
27-11
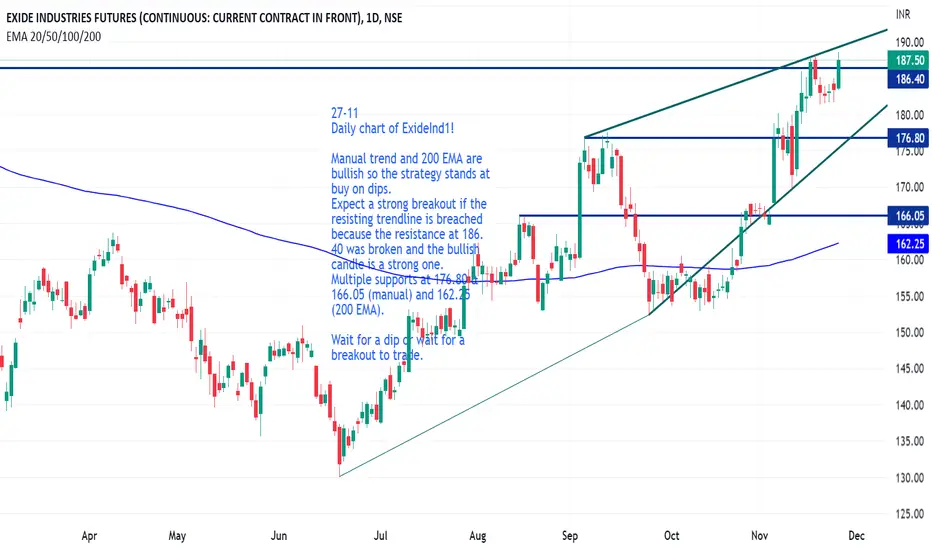
Daily chart of ExideInd1!
Manual trend and 200 EMA are bullish so the strategy stands at buy on dips.
Expect a strong breakout if the resisting trendline is breached because the resistance at 186.40 was broken and the bullish candle is a strong one.
Multiple supports at 176.80 & 166.05 (manual) and 162.25 (200 EMA).
Wait for a dip or wait for a breakout to trade.
Daily chart of ExideInd1!
Manual trend and 200 EMA are bullish so the strategy stands at buy on dips.
Expect a strong breakout if the resisting trendline is breached because the resistance at 186.40 was broken and the bullish candle is a strong one.
Multiple supports at 176.80 & 166.05 (manual) and 162.25 (200 EMA).
Wait for a dip or wait for a breakout to trade.

免責聲明
這些資訊和出版物並非旨在提供,也不構成TradingView提供或認可的任何形式的財務、投資、交易或其他類型的建議或推薦。請閱讀使用條款以了解更多資訊。
免責聲明
這些資訊和出版物並非旨在提供,也不構成TradingView提供或認可的任何形式的財務、投資、交易或其他類型的建議或推薦。請閱讀使用條款以了解更多資訊。