
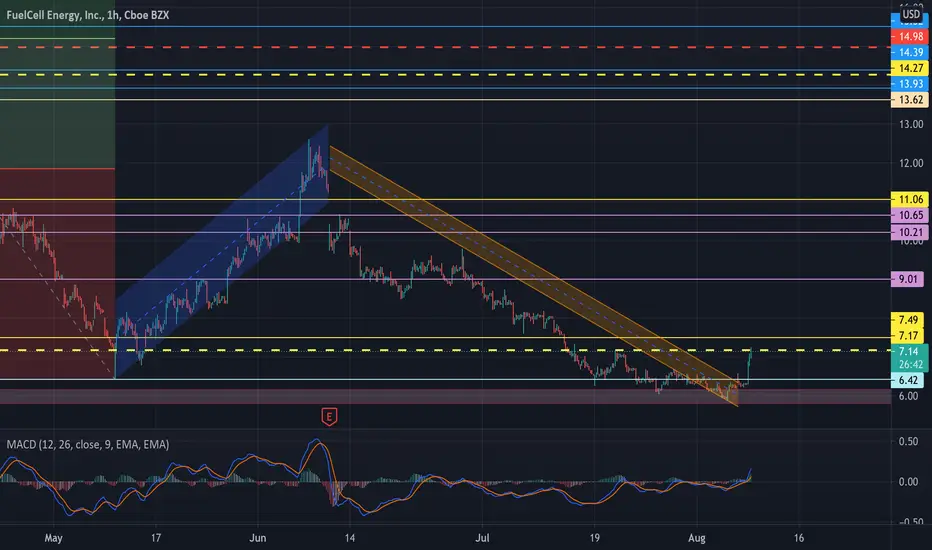
Disclaimer this may be wrong and I'm still learning like the rest; however, I've been holding since January and watched it go from 14 to 28 then all the way down to 6. So, to prevent bias in this information this is all a TA analysis thus each bar line above the current price represents old supports aka new resistance levels. Granted there will be some taking profit from swings so at the EOD we should sit at closer supports.

免責聲明
這些資訊和出版物並非旨在提供,也不構成TradingView提供或認可的任何形式的財務、投資、交易或其他類型的建議或推薦。請閱讀使用條款以了解更多資訊。