
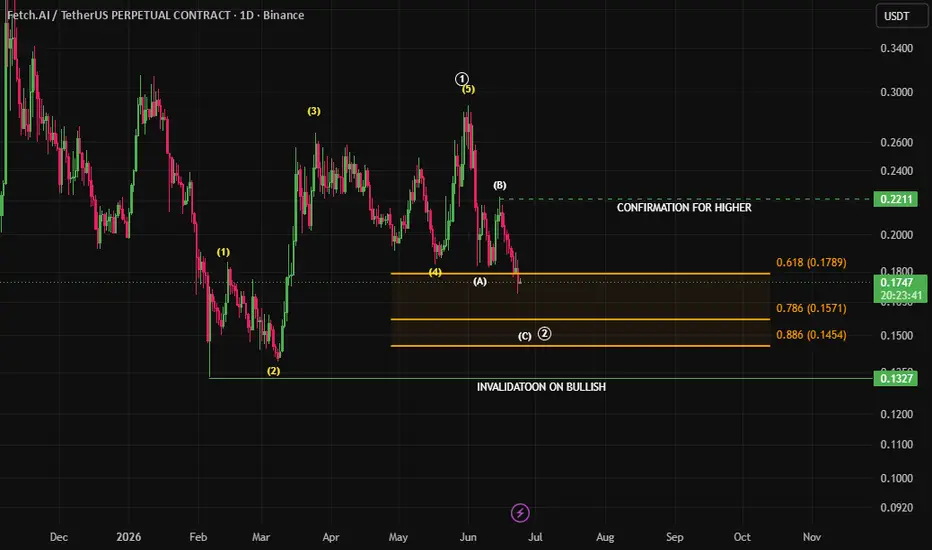
📊 FET/USDT Elliott Wave Update (1D Timeframe)
🔍 Market Structure Overview
The current Elliott Wave count suggests that Fetch.ai (Fetch.ai/) (FET) is still correcting the larger impulsive advance that ended near the recent swing high around $0.30.
The structure appears to be unfolding as a larger ABC correction, with Wave (A) already completed and Wave (B) likely having topped. The market now seems to be developing the final leg lower in Wave (C).
━━━━━━━━━━━━━━
📌 Preferred Elliott Wave Scenario
From the chart:
🔹 A completed five-wave advance culminated near the June high, marking the end of a larger impulsive sequence.
🔹 The decline that followed is counted as Wave (A).
🔹 The subsequent rebound formed Wave (B), which failed to reclaim the major resistance zone and showed corrective characteristics.
🔹 Price is currently testing the Wave (A) low, suggesting that Wave (C) may now be underway.
📉 As long as the market remains below the confirmation level, the correction remains the preferred scenario.
━━━━━━━━━━━━━━
🎯 Key Support Zone
The chart highlights a major Fibonacci support cluster:
📍 0.786 Retracement: $0.157
📍 0.886 Retracement: $0.145
This area represents the most probable termination zone for Wave (C) and the completion of the entire corrective structure.
💡 In Elliott Wave analysis, Wave (C) commonly terminates between the 0.786 and 0.886 retracement levels during deep corrections.
━━━━━━━━━━━━━━
🚀 Bullish Confirmation
For the bullish scenario to gain credibility, FET needs to reclaim:
📍 $0.211
A sustained break and close above this level would indicate that buyers are regaining control and that the correction may already be complete.
Until then, rallies are treated as corrective bounces within the broader pullback.
━━━━━━━━━━━━━━
❌ Invalidation Level
🔴 $0.137
A decisive breakdown below this level would invalidate the bullish recovery outlook and suggest a much larger bearish structure is developing.
━━━━━━━━━━━━━━
⚠️ What To Watch
✅ Strong buying reactions between $0.157–$0.145.
✅ Bullish divergence on momentum indicators near support.
✅ A breakout above $0.211 to confirm trend reversal.
❌ Failure to hold the Fibonacci support zone would increase downside risk.
━━━━━━━━━━━━━━
📈 Summary
The preferred Elliott Wave count suggests that FET is completing a Wave (C) correction, with the ideal support zone located between $0.157 and $0.145.
🎯 This region may offer the foundation for the next major impulsive advance if buyers step in.
🚀 A confirmed break above $0.211 would be the first signal that the correction has ended and that a new bullish phase is beginning.
⚠️ Until confirmation arrives, caution remains warranted as the market continues to trade within a corrective structure.
#FET #FetchAI #ASI #ElliottWave #Crypto #Trading 📊🔥🚀
🔍 Market Structure Overview
The current Elliott Wave count suggests that Fetch.ai (Fetch.ai/) (FET) is still correcting the larger impulsive advance that ended near the recent swing high around $0.30.
The structure appears to be unfolding as a larger ABC correction, with Wave (A) already completed and Wave (B) likely having topped. The market now seems to be developing the final leg lower in Wave (C).
━━━━━━━━━━━━━━
📌 Preferred Elliott Wave Scenario
From the chart:
🔹 A completed five-wave advance culminated near the June high, marking the end of a larger impulsive sequence.
🔹 The decline that followed is counted as Wave (A).
🔹 The subsequent rebound formed Wave (B), which failed to reclaim the major resistance zone and showed corrective characteristics.
🔹 Price is currently testing the Wave (A) low, suggesting that Wave (C) may now be underway.
📉 As long as the market remains below the confirmation level, the correction remains the preferred scenario.
━━━━━━━━━━━━━━
🎯 Key Support Zone
The chart highlights a major Fibonacci support cluster:
📍 0.786 Retracement: $0.157
📍 0.886 Retracement: $0.145
This area represents the most probable termination zone for Wave (C) and the completion of the entire corrective structure.
💡 In Elliott Wave analysis, Wave (C) commonly terminates between the 0.786 and 0.886 retracement levels during deep corrections.
━━━━━━━━━━━━━━
🚀 Bullish Confirmation
For the bullish scenario to gain credibility, FET needs to reclaim:
📍 $0.211
A sustained break and close above this level would indicate that buyers are regaining control and that the correction may already be complete.
Until then, rallies are treated as corrective bounces within the broader pullback.
━━━━━━━━━━━━━━
❌ Invalidation Level
🔴 $0.137
A decisive breakdown below this level would invalidate the bullish recovery outlook and suggest a much larger bearish structure is developing.
━━━━━━━━━━━━━━
⚠️ What To Watch
✅ Strong buying reactions between $0.157–$0.145.
✅ Bullish divergence on momentum indicators near support.
✅ A breakout above $0.211 to confirm trend reversal.
❌ Failure to hold the Fibonacci support zone would increase downside risk.
━━━━━━━━━━━━━━
📈 Summary
The preferred Elliott Wave count suggests that FET is completing a Wave (C) correction, with the ideal support zone located between $0.157 and $0.145.
🎯 This region may offer the foundation for the next major impulsive advance if buyers step in.
🚀 A confirmed break above $0.211 would be the first signal that the correction has ended and that a new bullish phase is beginning.
⚠️ Until confirmation arrives, caution remains warranted as the market continues to trade within a corrective structure.
#FET #FetchAI #ASI #ElliottWave #Crypto #Trading 📊🔥🚀

免責聲明
這些資訊和出版物並非旨在提供,也不構成TradingView提供或認可的任何形式的財務、投資、交易或其他類型的建議或推薦。請閱讀使用條款以了解更多資訊。
免責聲明
這些資訊和出版物並非旨在提供,也不構成TradingView提供或認可的任何形式的財務、投資、交易或其他類型的建議或推薦。請閱讀使用條款以了解更多資訊。