
👋 Welcome to TradeCityPro!
In this analysis, I want to review the FET coin , one of the crypto projects related to artificial intelligence, with a $635 million market cap, currently ranked 78th on CoinMarketCap.
⏳ 4-Hour Timeframe
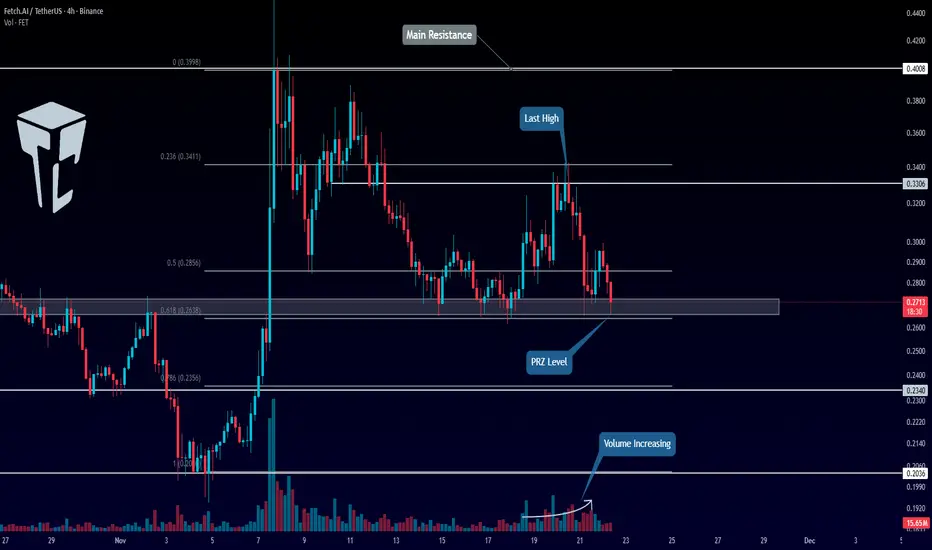
On the 4-hour timeframe, this coin had an upward movement and then entered a correction phase, reaching an important PRZ support zone.
💡 The zone the price is currently testing is a very critical support area, which we had already identified in the chart. Additionally, this zone coincides with the golden Fibonacci zone.
✔️ Given the length of time the price has been correcting, we can confirm a trend change sooner and don’t need to wait for the main support at 0.2036 to be broken.
🔔 Currently, the selling volume is increasing, and the price has reached the lower bound of the box between 0.2638 and 0.3306.
🧮 There’s significant bearish momentum entering the market, and it can be said that the only reason some coins like FET are still holding above their support is Bitcoin’s dominance.
⚖️ If the price stabilizes below its support zone, we will confirm the bearish trend and can open a short position. The next support levels are 0.2340 and 0.2036.
💫 However, if the price rises and moves toward the upper bound of the box, breaking 0.3306, we can become optimistic about the coin’s upward movement again.
📝 Final Thoughts
Stay calm, trade wisely, and let's capture the market's best opportunities!
This analysis reflects our opinions and is not financial advice.
Share your thoughts in the comments, and don’t forget to share this analysis with your friends! ❤️
In this analysis, I want to review the FET coin , one of the crypto projects related to artificial intelligence, with a $635 million market cap, currently ranked 78th on CoinMarketCap.
⏳ 4-Hour Timeframe
On the 4-hour timeframe, this coin had an upward movement and then entered a correction phase, reaching an important PRZ support zone.
💡 The zone the price is currently testing is a very critical support area, which we had already identified in the chart. Additionally, this zone coincides with the golden Fibonacci zone.
✔️ Given the length of time the price has been correcting, we can confirm a trend change sooner and don’t need to wait for the main support at 0.2036 to be broken.
🔔 Currently, the selling volume is increasing, and the price has reached the lower bound of the box between 0.2638 and 0.3306.
🧮 There’s significant bearish momentum entering the market, and it can be said that the only reason some coins like FET are still holding above their support is Bitcoin’s dominance.
⚖️ If the price stabilizes below its support zone, we will confirm the bearish trend and can open a short position. The next support levels are 0.2340 and 0.2036.
💫 However, if the price rises and moves toward the upper bound of the box, breaking 0.3306, we can become optimistic about the coin’s upward movement again.
📝 Final Thoughts
Stay calm, trade wisely, and let's capture the market's best opportunities!
This analysis reflects our opinions and is not financial advice.
Share your thoughts in the comments, and don’t forget to share this analysis with your friends! ❤️

💥 Don’t Miss Out!
🏆 Trade & Earn : bitunix.com/register?vipCode=TCPINT
💰 Join the Telegram Channel Now: t.me/Tradecityproint
🤵 Business Contact: Tradecityproteam@gmail.com
🏆 Trade & Earn : bitunix.com/register?vipCode=TCPINT
💰 Join the Telegram Channel Now: t.me/Tradecityproint
🤵 Business Contact: Tradecityproteam@gmail.com
免責聲明
這些資訊和出版物並非旨在提供,也不構成TradingView提供或認可的任何形式的財務、投資、交易或其他類型的建議或推薦。請閱讀使用條款以了解更多資訊。
💥 Don’t Miss Out!
🏆 Trade & Earn : bitunix.com/register?vipCode=TCPINT
💰 Join the Telegram Channel Now: t.me/Tradecityproint
🤵 Business Contact: Tradecityproteam@gmail.com
🏆 Trade & Earn : bitunix.com/register?vipCode=TCPINT
💰 Join the Telegram Channel Now: t.me/Tradecityproint
🤵 Business Contact: Tradecityproteam@gmail.com
免責聲明
這些資訊和出版物並非旨在提供,也不構成TradingView提供或認可的任何形式的財務、投資、交易或其他類型的建議或推薦。請閱讀使用條款以了解更多資訊。