
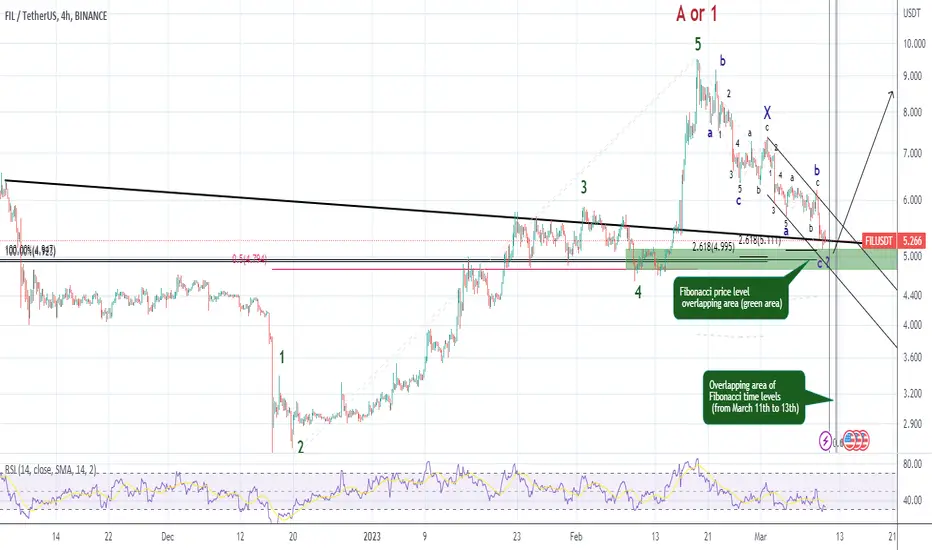
According to the price chart, it is located in the overlapping area of the Fibonacci price levels. And also the price is near a static resistance and a support trend line.
According to the price pattern on the chart, the price is "probably" at the end of its corrective pattern. In my opinion, this correction pattern should end between the 11th and 13th of March.
And the least I expect after the correction pattern ends is for the price to rise to the top of wave A or 1.
But the main targets of this price increase are respectively $20 (100% Fibonacci extension of wave A or 1 from the bottom of the corrective pattern) and $46 (162% Fibonacci extension).
And finally I see $183 (Fibonacci extension 262%).
According to the price pattern on the chart, the price is "probably" at the end of its corrective pattern. In my opinion, this correction pattern should end between the 11th and 13th of March.
And the least I expect after the correction pattern ends is for the price to rise to the top of wave A or 1.
But the main targets of this price increase are respectively $20 (100% Fibonacci extension of wave A or 1 from the bottom of the corrective pattern) and $46 (162% Fibonacci extension).
And finally I see $183 (Fibonacci extension 262%).

免責聲明
這些資訊和出版物並非旨在提供,也不構成TradingView提供或認可的任何形式的財務、投資、交易或其他類型的建議或推薦。請閱讀使用條款以了解更多資訊。
免責聲明
這些資訊和出版物並非旨在提供,也不構成TradingView提供或認可的任何形式的財務、投資、交易或其他類型的建議或推薦。請閱讀使用條款以了解更多資訊。