
Executive Summary
Flow Traders, flowtraders.com/
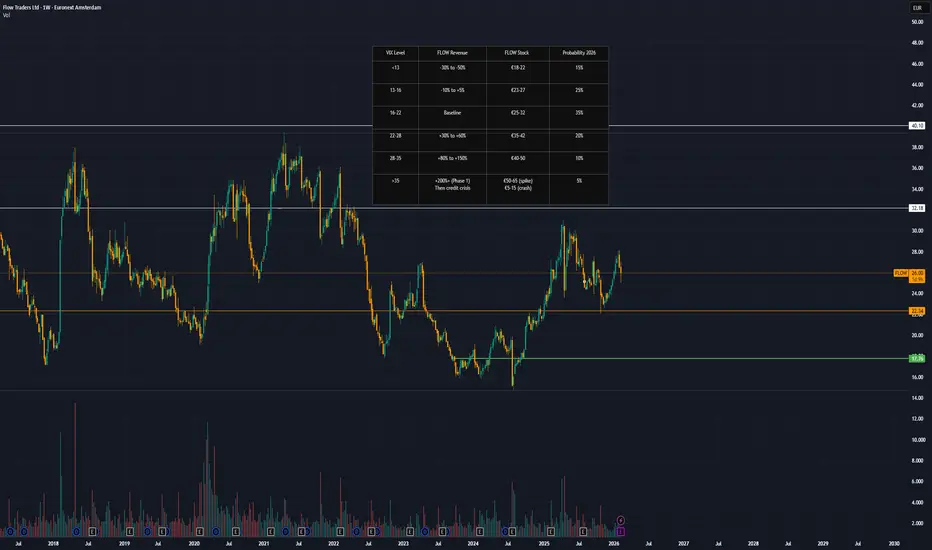
the Amsterdam-listed ETP market maker, presents a fascinating risk/reward proposition at its current price of €25.80. Trading at a P/E of just 7.2x with a 23.6% ROE and a remarkable Beta of 0.14, the stock appears significantly undervalued. However, beneath the surface lie critical risks including €1.96B in short-term debt, zero dividend yield (down from 6.92%), and extreme earnings volatility. This analysis breaks down whether FLOW is a contrarian opportunity or a trap for the unwary.
📊 Company Overview
Flow Traders N.V. is a leading global financial technology-enabled liquidity provider specializing in Exchange Traded Products (ETPs). Founded in 2004, the company operates across equity, fixed income, commodities, and digital assets, providing liquidity to over 1,800 ETPs across 80+ exchanges worldwide.
Key Facts:
Market Cap: €1.178B
Current Price: €25.80 (as of Feb 11, 2026)
52-Week Range: €22.10 - €31.04
Employees: 635 FTE
Headquarters: Amsterdam, Netherlands
Exchange: Euronext Amsterdam (FLOW.AS)
💰 Q4 2025 & FY2025 Results Breakdown
The Good
Volume Growth:
ETP Value Traded: €516B (+22% Q4, +26% FY)
Market share gains across all regions
Trading Capital increased 35% to €1,044M
Profitability Maintained:
FY25 Net Income: €133.6M (EPS €3.07)
EBITDA Margin: 41% (both Q4 and FY)
ROE: 23.6% (TTM)
The Concerning
Revenue & Profit Decline:
Q4 Net Trading Income: -20% YoY (€123.8M)
Q4 Net Profit: -44% YoY (€35.1M vs €63.2M)
Asia revenue crashed -56% in Q4
Rising Costs:
Fixed Operating Expenses: +17% YoY (€52.4M Q4)
FY26 guidance: €220-230M opex (+8-13%)
Technology & employee costs surging
Cash Flow Deterioration:
Operating Cash Flow: €32M (down from €271M in 2020)
Working Capital drain: -€191M in 2024
Free Cash Flow nearly zero
📈 Historical Performance: The 2020 Distortion
│ Year │ Revenue │ Net Income │ EPS │ ROE │ DPS │ Comment │
├──────┼─────────┼────────────┼───────┼─────┼──────┼─────────
│ 2019 │ €352M │ €53M │ €1.14 │ 16% │ €0.76│ Pre-COVID baseline │
│ 2020 │ €1,090M │ €464M │ €9.81 │ 79% │ €5.52│ COVID volatility bonanza │
│ 2021 │ €542M │ €115M │ €2.51 │ 23% │ €1.14│ Normalization begins │
│ 2022 │ €677M │ €127M │ €2.76 │ 21% │ €1.27│ Recovery year │
│ 2023 │ €577M │ €36M │ €0.81 │ 6% │ €0.38│ Weak volatility │
│ 2024 │ €801M │ €160M │ €3.56 │ 21% │ €0.00│ Dividend cut │
└──────┴─────────┴────────────┴───────┴─────┴──────┴─────────
💡 Key Insight: The 5-year CAGR of 25.5% for EPS is heavily skewed by the 2020 outlier (€9.81 EPS).
Normalized EPS (excluding 2020 and 2023): ~€2.60
⚖️ Valuation Analysis: Cheap or Fairly Priced?
Current Metrics
P/E Ratio: 7.16x (vs. sector average 12-18x)
P/B Ratio: 1.45x (Book Value €17.80/share)
PEG Ratio: 0.28 (anything <1.0 is typically attractive)
EV/EBITDA: ~6.5x
Fair Value Estimates
│ Method │ Fair Value │ Upside │ Assumption │
│ Sector P/E (12x) │ €43.20 │ +67% │ Re-rating to peer average │
│ Normalized Earnings (10x P/E) │ €26.00 │ +1% │ €2.60 normalized EPS │
│ ROE-Based (Gordon Growth) │ €38-42 │ +47-63% │ 8-10% sustainable growth │
│ Sum-of-Parts │ €28-30 │ +9-16% │ Core + growth options │
│ DCF (Conservative) │ €22-26 │ -9 to +1%│ Based on weak current FCF │
📊 Consensus: €30-35 represents fair value (+16-36% upside)
🎯 Market is currently pricing: Normalized earnings at fair P/E, with ZERO value assigned to growth initiatives (China, tokenization, AI)
🚨 Critical Risk Factors
1. Extreme Leverage - The Elephant in the Room
Total Debt: €1.96B
Shareholders' Equity: €767M
Debt-to-Equity: 256%
Short-term Debt: €1.91B (97% of total)
The Problem: Almost all debt matures within 12 months. In a credit crisis (2008-style), refinancing could become impossible, leading to forced deleveraging or bankruptcy.
Historical Parallel: Bear Stearns collapsed in 2008 despite being profitable when credit lines were cut.
2. Dividend Annihilation
From a reliable 6.92% yield (€5.52 in 2020) to ZERO in 2024.
Why it matters:
Removed income support for stock price
Total dividends 2020-2023: €452M (more than 2024's full-year profit!)
Signals management prioritizing growth over shareholder returns
3. Earnings Volatility
EPS Range (2019-2024): €0.81 to €9.81 (12x variance!)
This isn't a steady compounder—it's a volatility lottery ticket.
4. Cash Flow Collapse
2020 Operating CF: €271M
2024 Operating CF: €32M (-88%)
Working Capital increasing dramatically (€191M drain in 2024)
Implication: Despite profitable on paper, the business is consuming cash.
🎯 Growth Initiatives: Hope or Hype?
1. China Expansion 🇨🇳
Status: Just launched Q4 2025
Investment: €30-40M
Potential: €50-100M annual revenue
Timeline: 12-24 months
Success Probability: 40%
Risks: Regulatory uncertainty, capital controls, geopolitical tensions (Taiwan)
2. Tokenization / Real-World Assets 🪙
Status: Early stage (Dinari partnership for 24/7 tokenized equities)
Investment: €40-50M
Potential: €30-80M annual revenue
Timeline: 24-36 months
Success Probability: 30%
Opportunity: Flow's 20 years of ETP expertise + crypto native capabilities = unique positioning
Reality Check: Tokenization is 2-5 years from mass adoption. Regulatory framework unclear.
3. AI & Deep Learning 🤖
Investment: €30-40M
Potential: Efficiency gains, margin improvement
Timeline: 18-24 months
Success Probability: 60%
Most Credible: Incremental improvements likely, but unlikely to be transformational alone.
📊 Scenario Analysis: 12-Month Price Targets
BEAR CASE (30% probability): €12-20 (-53% to -22%)
Triggers:
Sustained low volatility (VIX <14 for 6+ months)
China expansion blocked/fails
Credit crunch affecting debt refinancing
FY26 EPS falls to €0.80-1.20
Investment Implication: Avoid or exit immediately
BASE CASE (40% probability): €26-32 (+1% to +24%)
Triggers:
Moderate volatility (VIX 16-22)
China contributes modestly (€20-30M earnings)
Margins stabilize at 38-40%
FY26 EPS: €2.80-3.20
Investment Implication: Fair value already priced in; limited upside without catalysts
BULL CASE (25% probability): €38-45 (+47% to +74%)
Triggers:
China delivers strong results (€50M+ contribution by Q3 2026)
Tokenization partnerships announced at Capital Markets Day
Market re-rates to 11-12x P/E
FY26 EPS: €5.00-6.00
Investment Implication: Significant upside if growth stories materialize
VOLATILITY SPIKE (25% probability): €40-48 (+55% to +86%)
Triggers:
Market correction -15-25% (S&P 500)
VIX sustained 25-35
Trump tariff chaos / geopolitical crisis
2020-style revenue surge
Investment Implication: Best case for FLOW, but...
CRITICAL WARNING: In extreme crashes with credit freezes, initial spike could reverse to €5-10 if debt refinancing fails (Phase 2 credit crisis).
🔑 The Beta 0.14 Advantage: Portfolio Diversifier
What Beta 0.14 Means:
When S&P 500 drops -10%, FLOW typically moves only -1.4%
Near-zero correlation with broad markets
Market makers profit from volatility, not direction
Historical Evidence:
2020: Market crashed -30%, FLOW had its BEST year ever (+464M profit)
2023: Bull market with low volatility = WORST year (€36M profit)
Portfolio Application:
FLOW acts as a volatility hedge, not a traditional equity position. Ideal for investors expecting turbulent markets regardless of direction.
💡 Investment Thesis: For Whom?
✅ BUY IF:
You believe 2026 will see elevated volatility (Trump tariffs, geopolitical tensions, recession fears)
You can tolerate 50%+ drawdowns
You view this as 8-12% of a diversified portfolio (NOT 25%+)
You're patient with 18-24 month time horizon
You believe tokenization will become mainstream by 2028-2030
❌ AVOID IF:
You need dividend income
You require stable, predictable earnings
You're investing >15% of portfolio in single position
You can't monitor for credit crisis warning signs
You're conservative/risk-averse
📋 Recommended Position Sizing & Strategy
For Aggressive Growth Investors:
Allocation: 8-12% maximum (NOT 25%)
Entry Strategy:
6% at current levels (€24-26)
6% on dip to €22-23 (if occurs)
Exit Strategy:
Sell 50% at €32-35 (+24-36%) - lock in gains
Sell 25% at €40-45 (+55-74%) - take profits on volatility spike
Keep 25% for moonshot (€50+ if tokenization hits)
STOP LOSS: €20 (-22%) - if breached, thesis broken
For Moderate Investors:
Allocation: 5-8% maximum
Entry: Split between current and dips
Exit: More aggressive profit-taking at €30-32
Pair with: Defensive stocks (Nestlé, Roche) and 30%+ cash
For Conservative Investors:
Allocation: 0-3%
Recommendation: PASS - Too volatile, zero dividend, high leverage risk
Alternatives:
Deutsche Börse (DB1.DE) - Similar volatility exposure, stronger balance sheet
Gold miners - Crash hedge with less refinancing risk
🚨 Critical Sell Signals - Exit Immediately If:
│ Warning Sign │ Action │ Reason │
├─────────────────────────────────┼──────────────┼───────────
│ VIX <12 for >3 months │ Sell 50% │ Low volatility = low earnings │
│ Q1 2026 margins <30% │ Sell 50% │ Structural deterioration │
│ Credit spreads >200bps │ Sell 100% │ Credit crisis imminent │
│ ECB emergency meetings │ Sell 100% │ Systemic risk (2008 repeat) │
│ China regulatory block │ Sell 25-50% │ Growth story dead │
│ FLOW hits €35+ on spike │ Sell 75% │ Lock gains before potential crash│
📅 Key Catalysts to Watch (2026)
Q1 2026:
✅ Capital Markets Day (details on tokenization strategy)
✅ Q1 earnings (margin trajectory critical)
⚠️ Trump tariff implementation (volatility catalyst)
Q2-Q3 2026:
✅ First China operations metrics
✅ Dinari partnership volume data
⚠️ Potential market correction (recession fears)
Q4 2026:
✅ FY26 guidance
✅ Potential dividend reinstatement
⚠️ Credit market stress signals
🎯 Final Verdict
Rating: 3/5 Stars ⭐⭐⭐
HOLD / SELECTIVE BUY at €25.80
The Bull Case:
Extreme valuation discount (P/E 7.2x vs 12-18x sector)
China + tokenization optionality worth €260-530M (not priced in)
Beta 0.14 = perfect Trump-era volatility hedge
2026 macro environment likely volatile (tailwind)
The Bear Case:
€1.96B short-term debt = existential risk in credit crisis
Cash flow deterioration (-88% since 2020)
Zero dividend = no income support
Growth initiatives unproven (40% China success rate, 30% tokenization)
The Reality:
Flow Traders is fairly valued for normalized earnings (~€2.60 EPS @ 10x P/E = €26). The stock is essentially a free call option on:
Sustained market volatility (VIX >20)
China expansion success
Tokenization revolution
If you believe any of those three, FLOW offers 50-100% upside. But if wrong, -20-50% downside (or worse in credit crisis).
💬 Conclusion
Flow Traders at €25.80 is neither a screaming buy nor a clear avoid. It's a calculated speculation for investors who:
Believe 2026 will be volatile (Trump, tariffs, recession)
Can size it appropriately (8-12% max)
Have discipline to sell on spikes
Understand the leverage risks
This is not a buy-and-hold dividend compounder. It's a volatility lottery ticket with better odds than most.
For those with conviction on elevated 2026 volatility and tokenization's long-term potential, a small position (8-12%) at current levels makes sense with strict risk management.
For everyone else, there are safer ways to play the "crash trade" (gold, defensive stocks, cash).
📊 Quick Reference Scorecard
┌───────────────────────┬─────────┬──────────┐
│ Factor │ Score │ Weight │
├───────────────────────┼─────────┼──────────┤
│ Valuation │ 8/10 │ High │
│ Growth Potential │ 7/10 │ Medium │
│ Financial Health │ 3/10 │ High │
│ Dividend │ 0/10 │ Low │
│ Risk Level │ 2/10 │ Critical │
│ Management Vision │ 8/10 │ Medium │
├───────────────────────┼─────────┼──────────┤
│ OVERALL │ 5.5/10 │MODERATE │
└───────────────────────┴─────────┴──────────┘
Disclaimer: This analysis is for educational purposes only and does not constitute financial advice. Always conduct your own due diligence and consult with a financial advisor before making investment decisions. The author may or may not hold positions in the securities discussed.
Key Takeaway: Flow Traders is a high-risk, high-reward volatility play trading at fair value with significant optionality. Size appropriately, manage risk religiously, and be prepared to act quickly in either direction. 📈📉

免責聲明
這些資訊和出版物並非旨在提供,也不構成TradingView提供或認可的任何形式的財務、投資、交易或其他類型的建議或推薦。請閱讀使用條款以了解更多資訊。
免責聲明
這些資訊和出版物並非旨在提供,也不構成TradingView提供或認可的任何形式的財務、投資、交易或其他類型的建議或推薦。請閱讀使用條款以了解更多資訊。