做多
FANTOM ; into Falling Wedge Pattern
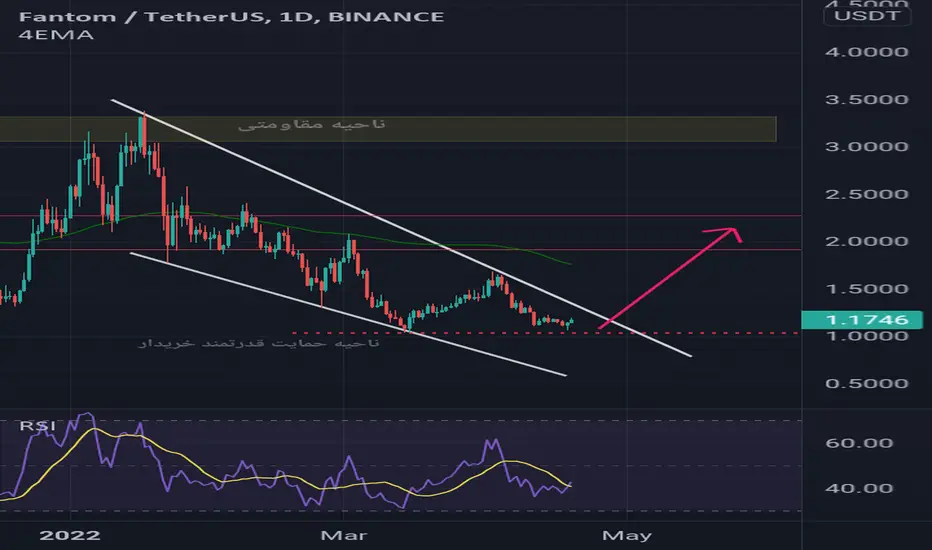
The Fantom has Formed a Falling wedge pattern on the its daily chart in the last few weeks so if the bulls could breaks upper trend line i think it will started a bullish move up to second major resistance as i've Marked by my red arrow.
Happy trading 🌷
Check out last my analysis
Happy trading 🌷
Check out last my analysis

免責聲明
這些資訊和出版物並非旨在提供,也不構成TradingView提供或認可的任何形式的財務、投資、交易或其他類型的建議或推薦。請閱讀使用條款以了解更多資訊。