做多
Fantom/usdt
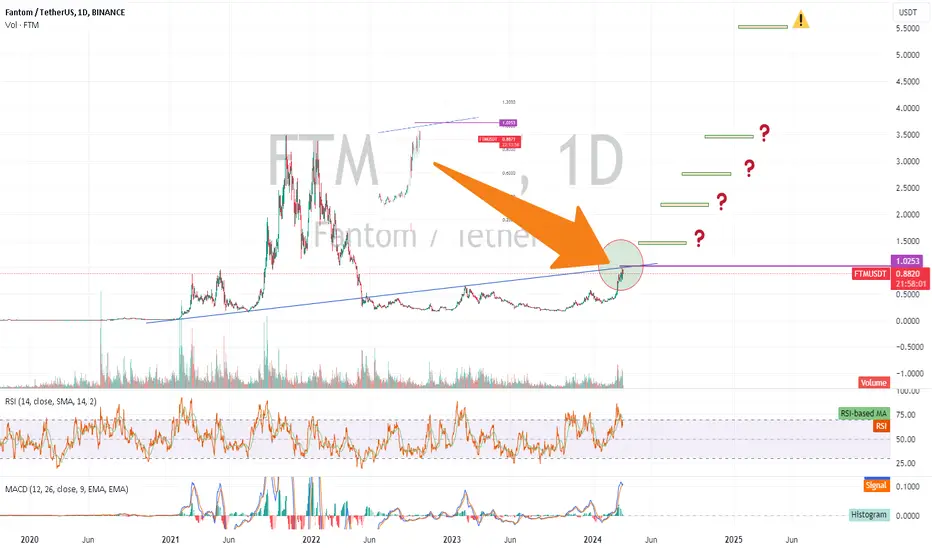
Best Chart You can see today
fantom looks really interesting but we need just a breakout the trend ( as chart shows ) and close above with daily candle & high volume
Target on chart Starting from 1.5$ to 3.5$
for 5.5$ maybe it will take couple of months
this is a personal opinion and NFA
Thank you
fantom looks really interesting but we need just a breakout the trend ( as chart shows ) and close above with daily candle & high volume
Target on chart Starting from 1.5$ to 3.5$
for 5.5$ maybe it will take couple of months
this is a personal opinion and NFA
Thank you
交易進行
FTM Daily & Weekly Chart Ultra Bullish & we are about reaching our first target 1.45$-1.47$交易進行
Cause of market correction ftm it may fall bellow 1$ again , we need to pay attention if you are invester ( long term trader ) that's means your targets still active & if you are daily trader you need to make your stop lost daily close bellow 1$ good luck everyone
交易結束:達到停損點
stop lost reached replace buying order btw 0.7$ - 0.85$
免責聲明
這些資訊和出版物並非旨在提供,也不構成TradingView提供或認可的任何形式的財務、投資、交易或其他類型的建議或推薦。請閱讀使用條款以了解更多資訊。