Fantom Daily Analysis
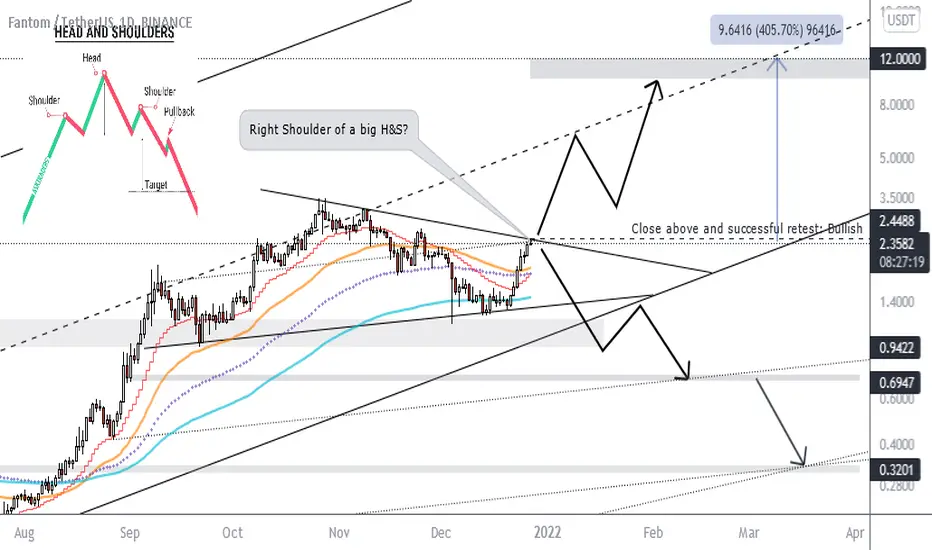
FTM is at the resistance of a triangle and the most important level to determine if it's going to be bullish or bearish. If a daily candle closes above 2.4488 the higher target at $12 is reachable. In another scenario if this level gets rejected the right shoulder of a head and shoulders pattern will be formed and in case of losing the support at $1.4 next supports to hold the price are 0.94, 0.69 and 0.32.

免責聲明
這些資訊和出版物並非旨在提供,也不構成TradingView提供或認可的任何形式的財務、投資、交易或其他類型的建議或推薦。請閱讀使用條款以了解更多資訊。