Long
🔥 FTM Bearish Triangle: Bouncing Up!
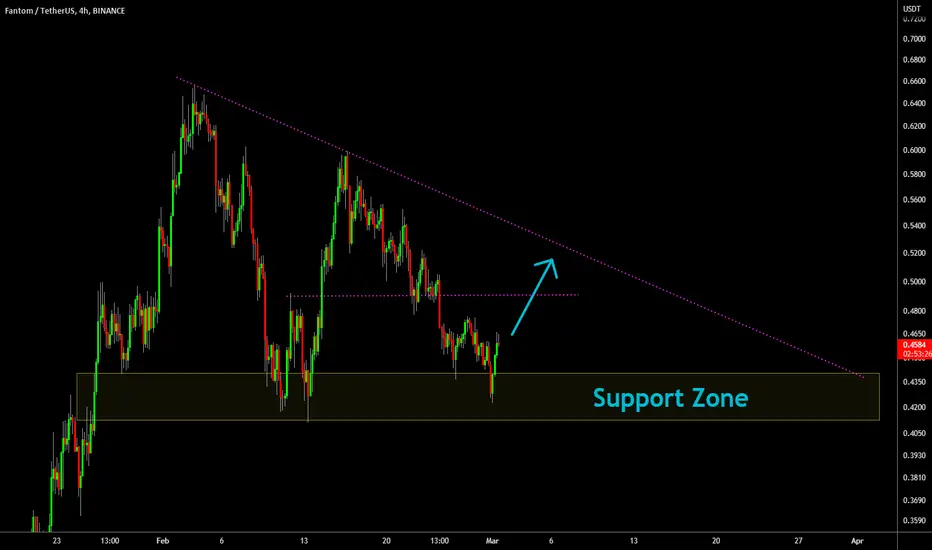
FTM appears to be trading inside a bearish triangle, with a well-defined descending resistance line and a horizontal support zone.
After reaching the yellow zone of support, FTM bounced notably. With BTC at a +2% today, it would make sense that we'd get some kind of bounce going over the next 1-2 days.
I'm looking at the top of the triangle for a potential exit. Partial profits at $0.49
After reaching the yellow zone of support, FTM bounced notably. With BTC at a +2% today, it would make sense that we'd get some kind of bounce going over the next 1-2 days.
I'm looking at the top of the triangle for a potential exit. Partial profits at $0.49

🎯Official Channel: t.me/FieryTradingChannel
📈Try my Premium Signals for FREE - 80% Win-Rate: t.me/FT_Futures_free
✅Monster Signals: t.me/monster_cryptosignals
🔥Premium Signals: fierytrading.com
📈Try my Premium Signals for FREE - 80% Win-Rate: t.me/FT_Futures_free
✅Monster Signals: t.me/monster_cryptosignals
🔥Premium Signals: fierytrading.com
相關出版品
免責聲明
這些資訊和出版物並非旨在提供,也不構成TradingView提供或認可的任何形式的財務、投資、交易或其他類型的建議或推薦。請閱讀使用條款以了解更多資訊。
🎯Official Channel: t.me/FieryTradingChannel
📈Try my Premium Signals for FREE - 80% Win-Rate: t.me/FT_Futures_free
✅Monster Signals: t.me/monster_cryptosignals
🔥Premium Signals: fierytrading.com
📈Try my Premium Signals for FREE - 80% Win-Rate: t.me/FT_Futures_free
✅Monster Signals: t.me/monster_cryptosignals
🔥Premium Signals: fierytrading.com
相關出版品
免責聲明
這些資訊和出版物並非旨在提供,也不構成TradingView提供或認可的任何形式的財務、投資、交易或其他類型的建議或推薦。請閱讀使用條款以了解更多資訊。