做多
FTM ANALYSIS
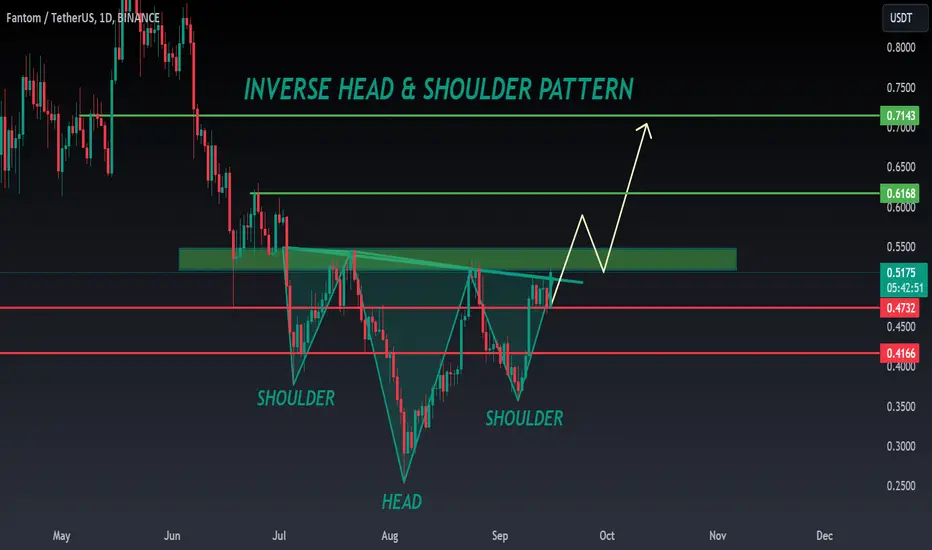
🚀#FTM Analysis : Pattern Formation
🔮As we can see in the chart of #FTM that there is a formation Inverse Head And Shoulder Pattern and it's a bullish pattern. If the candle closes above the neckline then a bullish move could be confirmed✅️
🔰Current Price: $0.5160
🎯 Target Price: $0.7140
⚡️What to do ?
👀Keep an eye on #FTM price action. We can trade according to the chart and make some profits⚡️⚡️
#FTM #Cryptocurrency #TechnicalAnalysis #DYOR
🔮As we can see in the chart of #FTM that there is a formation Inverse Head And Shoulder Pattern and it's a bullish pattern. If the candle closes above the neckline then a bullish move could be confirmed✅️
🔰Current Price: $0.5160
🎯 Target Price: $0.7140
⚡️What to do ?
👀Keep an eye on #FTM price action. We can trade according to the chart and make some profits⚡️⚡️
#FTM #Cryptocurrency #TechnicalAnalysis #DYOR

免責聲明
這些資訊和出版物並非旨在提供,也不構成TradingView提供或認可的任何形式的財務、投資、交易或其他類型的建議或推薦。請閱讀使用條款以了解更多資訊。