
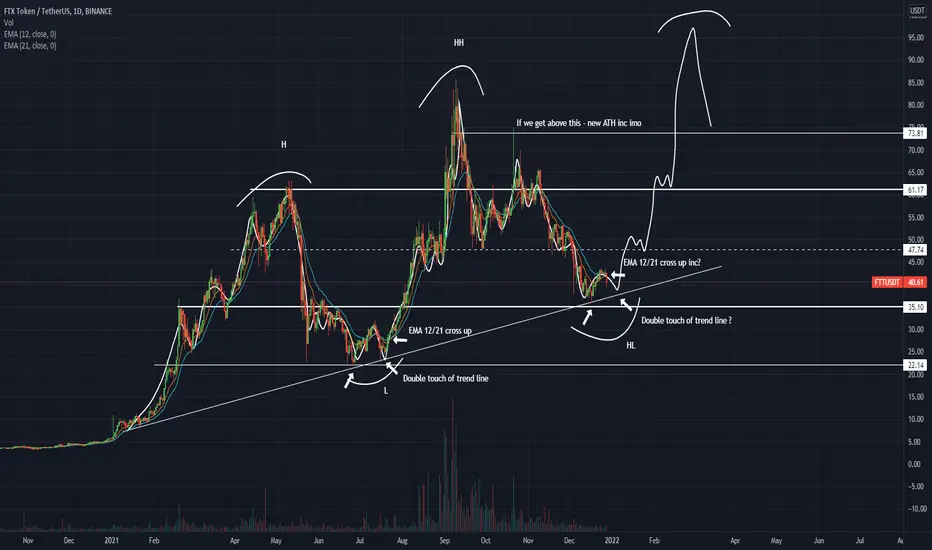
I was looking at FTT chart from HTF perspective and I could not unsee the similarities I saw in the beginning of the uptrend. We can clearly see HHs and HLs which confirm the uptrend but if you watch the double retest of trendline with EMA 12/21 crossing up - it started a huge move upwards to the new ATH. All I am saying is that it is looking like the trend line is gonna get double retested again and EMA 12/21 is on the verge of crossing up. I am gonna be closely watching FTT and if the 2nd retest of trend line holds (could be also wick to range low - $35), there is only one destination - somewhere up - possibly new ATH.
From LTF perspective, FTT is tradable within range $35 - $61 - buy low, sell high (take profit around mid range already imo :) )
From LTF perspective, FTT is tradable within range $35 - $61 - buy low, sell high (take profit around mid range already imo :) )

免責聲明
這些資訊和出版物並非旨在提供,也不構成TradingView提供或認可的任何形式的財務、投資、交易或其他類型的建議或推薦。請閱讀使用條款以了解更多資訊。