做多
Frax Share (FXS) Explosive Growth
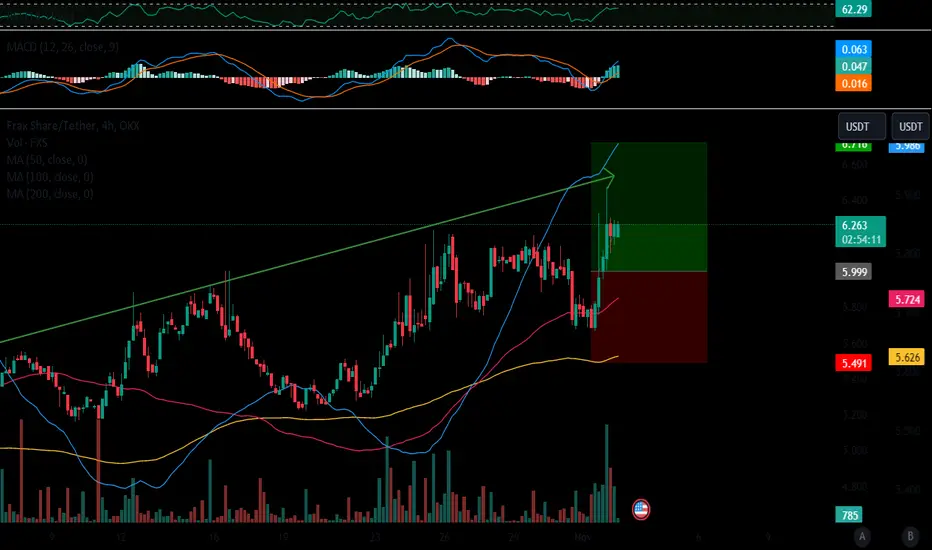
Frax Share (FXS)
FXS hasn't mirrored BTC’s explosive growth just yet. However, the Frax Share chart is currently on an upward trend, and the asset is experiencing steady growth, marked by occasional corrections and pullbacks.
Today, FXS reached a new local high at $6.43. The asset’s main objective is to maintain its upward momentum. The upcoming resistance levels for buyers are positioned at $6.65 and the psychological threshold of $7. If BTC continues to trade within a narrow range, FXS could potentially break through these levels in the foreseeable future.
A correction in line with the primary trend is also a possibility. Buyer orders are stacked within the support zone of $5.65-$5.84, as well as at the $5.46 and $5.21 levels. These zones could be appealing entry points for buyers.

免責聲明
這些資訊和出版物並非旨在提供,也不構成TradingView提供或認可的任何形式的財務、投資、交易或其他類型的建議或推薦。請閱讀使用條款以了解更多資訊。
免責聲明
這些資訊和出版物並非旨在提供,也不構成TradingView提供或認可的任何形式的財務、投資、交易或其他類型的建議或推薦。請閱讀使用條款以了解更多資訊。