
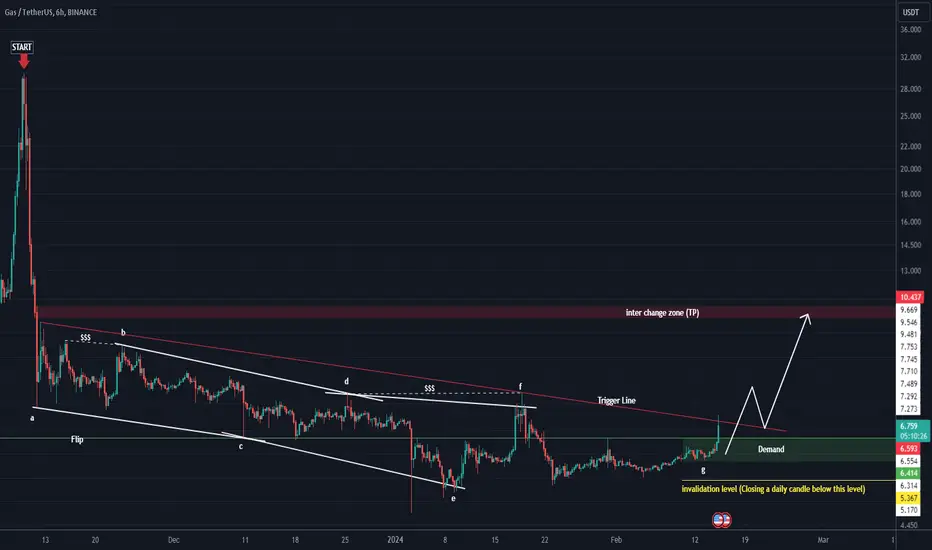
From where we entered "START" on the chart, it looks like a correction has started.
Examining the waves, it looks like a diametric is over.
There is a nice support range on the chart, and by maintaining this range, GAS can be pumped to sweep the liquidity pools.
Closing a daily candle below the invalidatio level will violate the analysis.
For risk management, please don't forget stop loss and capital management
Comment if you have any questions
Thank You
Examining the waves, it looks like a diametric is over.
There is a nice support range on the chart, and by maintaining this range, GAS can be pumped to sweep the liquidity pools.
Closing a daily candle below the invalidatio level will violate the analysis.
For risk management, please don't forget stop loss and capital management
Comment if you have any questions
Thank You

✅ Join our Telegram channel to succeed in trading.
💎Our CRYPTO Telegram Channel: 👉 t.me/Behdark_EN
💎Our FOREX Telegram Channel: 👉 t.me/FX_Behdark
💎Our CRYPTO Telegram Channel: 👉 t.me/Behdark_EN
💎Our FOREX Telegram Channel: 👉 t.me/FX_Behdark
免責聲明
這些資訊和出版物並非旨在提供,也不構成TradingView提供或認可的任何形式的財務、投資、交易或其他類型的建議或推薦。請閱讀使用條款以了解更多資訊。
✅ Join our Telegram channel to succeed in trading.
💎Our CRYPTO Telegram Channel: 👉 t.me/Behdark_EN
💎Our FOREX Telegram Channel: 👉 t.me/FX_Behdark
💎Our CRYPTO Telegram Channel: 👉 t.me/Behdark_EN
💎Our FOREX Telegram Channel: 👉 t.me/FX_Behdark
免責聲明
這些資訊和出版物並非旨在提供,也不構成TradingView提供或認可的任何形式的財務、投資、交易或其他類型的建議或推薦。請閱讀使用條款以了解更多資訊。