

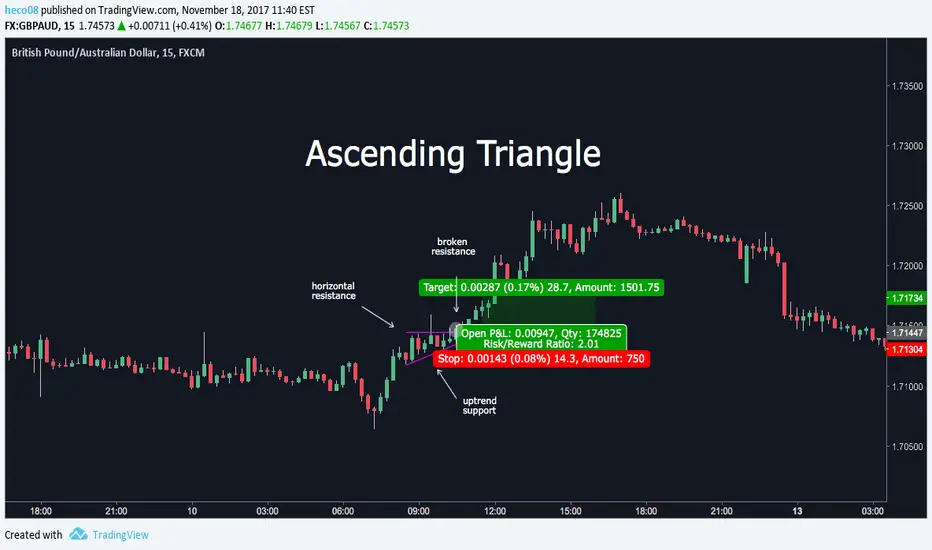
GBPAUD formed an ascending triangle. We could see a horizontal upper line (that would be a resistance) and a lower uptrend line (that would be a support).
Prices moves with equal highs, and lows higher than previous.
Then after a few attempts, the prices finally break through resistance.
The ascending triangle is a continuation pattern. Prices come from an uptrend then prices bounce inside the triangle before breaking higher.
To confirm the breakout, the price should close above the resistance line, if so, make a long. The profit target is the distance away as the back of the triangle.
Prices moves with equal highs, and lows higher than previous.
Then after a few attempts, the prices finally break through resistance.
The ascending triangle is a continuation pattern. Prices come from an uptrend then prices bounce inside the triangle before breaking higher.
To confirm the breakout, the price should close above the resistance line, if so, make a long. The profit target is the distance away as the back of the triangle.

免責聲明
這些資訊和出版物並非旨在提供,也不構成TradingView提供或認可的任何形式的財務、投資、交易或其他類型的建議或推薦。請閱讀使用條款以了解更多資訊。