

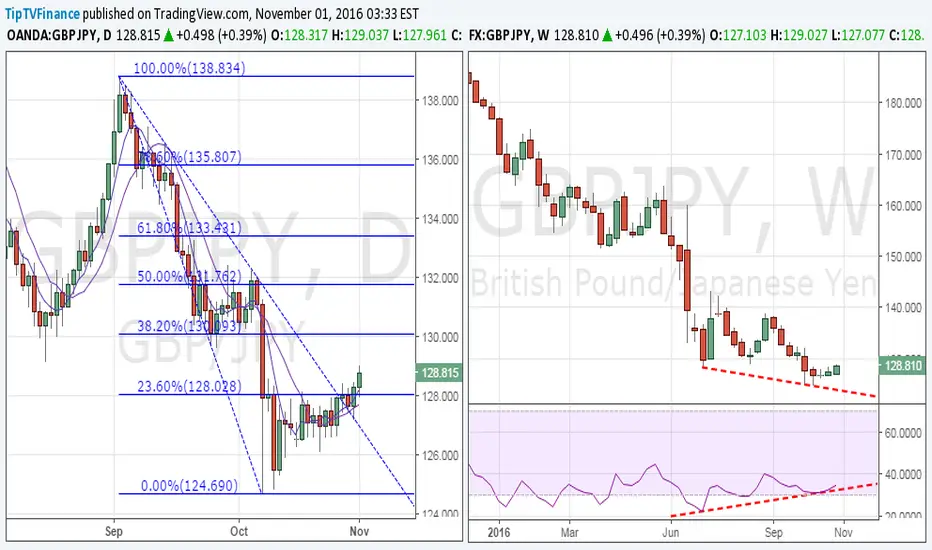
Daily/Weekly chart
· The pair finally closed above 128.03 (23.6% Fibo of Sept high and Oct low) after having repeated failed to do so last month. Also note the bullish 5-DMA and 10-DMA crossover.
· On the weekly chart, we have a bullish price RSI divergence. Consequently, the cross looks poised for a rise to 130.10 (38.2% Fibo).
· On the other hand, only a daily close below 127.19 (previous day’s low) would signal bullish invalidation.
· The pair finally closed above 128.03 (23.6% Fibo of Sept high and Oct low) after having repeated failed to do so last month. Also note the bullish 5-DMA and 10-DMA crossover.
· On the weekly chart, we have a bullish price RSI divergence. Consequently, the cross looks poised for a rise to 130.10 (38.2% Fibo).
· On the other hand, only a daily close below 127.19 (previous day’s low) would signal bullish invalidation.

免責聲明
這些資訊和出版物並非旨在提供,也不構成TradingView提供或認可的任何形式的財務、投資、交易或其他類型的建議或推薦。請閱讀使用條款以了解更多資訊。
免責聲明
這些資訊和出版物並非旨在提供,也不構成TradingView提供或認可的任何形式的財務、投資、交易或其他類型的建議或推薦。請閱讀使用條款以了解更多資訊。