
 GBPUSD
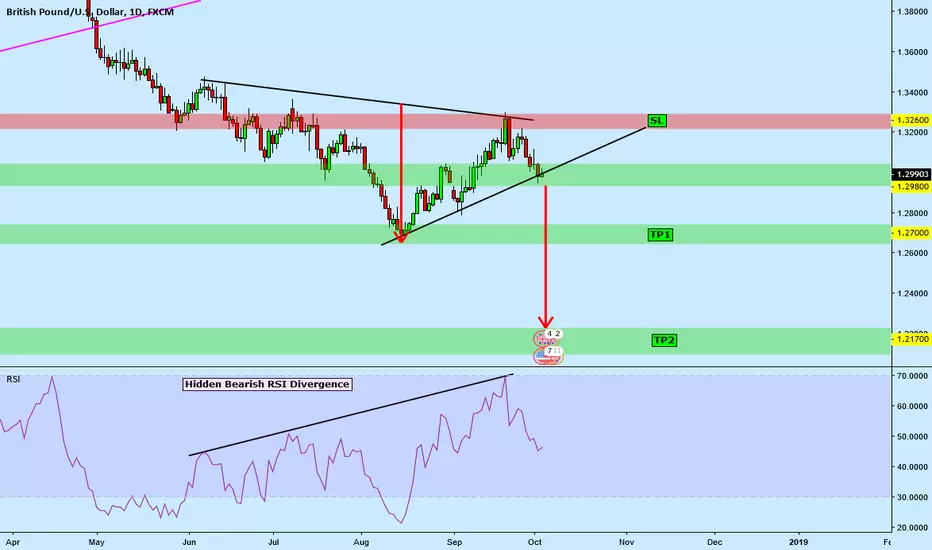
There's a Hidden RSI Bearish Divergence on the Daily Chart indicating a possible downtrend continuation.
A break below and daily candle close below the trendline and we may see price go as low as ~1.21700 ( Previous Low of March)
Short Entry: At close of Daily Candle below trendline
TP 1: 1.27000
TP 2: 1.21700
SL: 1.32600
This is longterm trade. Take profits as you wish.
註釋
註釋
TP 1: 1.27000 reached
免責聲明
這些資訊和出版物並非旨在提供,也不構成TradingView提供或認可的任何形式的財務、投資、交易或其他類型的建議或推薦。請閱讀使用條款以了解更多資訊。
免責聲明
這些資訊和出版物並非旨在提供,也不構成TradingView提供或認可的任何形式的財務、投資、交易或其他類型的建議或推薦。請閱讀使用條款以了解更多資訊。