GBP/USD Daily: Rejection Near 1.3552 Supply Zone Threatens Short-Term Bullish Structure
### 🇬🇧/🇺🇸 British Pound / U.S. Dollar (
 GBPUSD) Daily Technical Matrix (Ref: GBPUSD_2026-08-18_08-49-53.png)
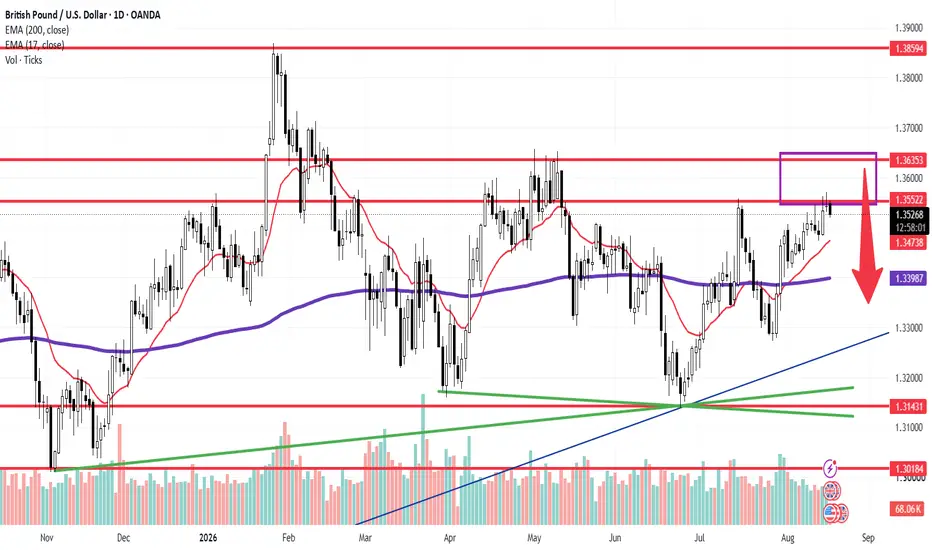
We are releasing an updated Daily (1D) structural matrix for GBP/USD (GBPUSD). Following a sustained rally from the July lows, price action has encountered immediate supply near the horizontal resistance node at **1.35522**, pointing toward a potential corrective pullback (red arrow vector) within the primary trend.
The pair is currently trading slightly lower at **1.35302 (-0.09%)**, consolidating just below the upper supply boundary.
---
### 🔍 Technical Architecture & Structural Levels:
Our quantitative setup isolates key dynamic moving averages and horizontal supply/demand zones:
1. **Supply Overhead (Highlighted Purple Zone):** The price is hesitating inside the **1.35522 – 1.36353** supply block. This region previously capped upward momentum, marking a key zone where sell-side volume is actively defending the boundary.
2. **Dynamic Moving Average Support Floor:**
* **17-Period EMA (Red Line):** **1.34742** — Serves as the immediate dynamic trailing floor for the current swing.
* **200-Period EMA (Purple Line):** **1.33987** — The macro institutional trend definition line.
3. **Macro Demand Structural Nodes:**
* **Confluent Trendline Support:** **1.31431** — Aligned with the multi-month blue ascending support line and green trendline intersection.
* **Macro Baseline Floor:** **1.30184**.
---
### 🛡️ Strategic Operational Scenarios:
* **Scenario A — Short-Term Corrective Pullback (Red Arrow):** Rejection from the **1.35522 – 1.36353** ceiling will trigger a pullback toward the dynamic **17-EMA support at 1.34742**. A deeper extension could retest the **200-EMA near 1.33987**, offering potential re-entry for medium-term buyers.
* **Scenario B — Bullish Breakout Continuation:** A decisive daily candle close above **1.36353** invalidates the bearish retracement thesis, opening a clean upside path toward major swing high resistance at **1.38594**.
### 📊 Tactical Parameters Summary:
* **Current Bias:** Neutral / Short-Term Pullback Risk
* **Primary Overhead Resistance Zone:** 1.35522 – 1.36353
* **Macro Peak Target (Scenario B Breakout):** 1.38594
* **Immediate Dynamic Support (17-EMA):** 1.34742
* **Institutional Macro Anchor (200-EMA):** 1.33987
* **Major Structural Confluence Floor:** 1.31431 / 1.30184
---
📊 **ChartPro Data**
*FX Market Architecture, Structural Supply/Demand & Systematic Risk Management.*
⚠️ **Disclaimer:** For educational and informational purposes only. This active market study represents a personal trading framework and does not constitute financial or investment advice.
### 🇬🇧/🇺🇸 British Pound / U.S. Dollar (
GBPUSD) Daily Technical Matrix (Ref: GBPUSD_2026-08-18_08-49-53.png)We are releasing an updated Daily (1D) structural matrix for GBP/USD (
GBPUSD). Following a sustained rally from the July lows, price action has encountered immediate supply near the horizontal resistance node at **1.35522**, pointing toward a potential corrective pullback (red arrow vector) within the primary trend.The pair is currently trading slightly lower at **1.35302 (-0.09%)**, consolidating just below the upper supply boundary.
---
### 🔍 Technical Architecture & Structural Levels:
Our quantitative setup isolates key dynamic moving averages and horizontal supply/demand zones:
1. **Supply Overhead (Highlighted Purple Zone):** The price is hesitating inside the **1.35522 – 1.36353** supply block. This region previously capped upward momentum, marking a key zone where sell-side volume is actively defending the boundary.
2. **Dynamic Moving Average Support Floor:**
* **17-Period EMA (Red Line):** **1.34742** — Serves as the immediate dynamic trailing floor for the current swing.
* **200-Period EMA (Purple Line):** **1.33987** — The macro institutional trend definition line.
3. **Macro Demand Structural Nodes:**
* **Confluent Trendline Support:** **1.31431** — Aligned with the multi-month blue ascending support line and green trendline intersection.
* **Macro Baseline Floor:** **1.30184**.
---
### 🛡️ Strategic Operational Scenarios:
* **Scenario A — Short-Term Corrective Pullback (Red Arrow):** Rejection from the **1.35522 – 1.36353** ceiling will trigger a pullback toward the dynamic **17-EMA support at 1.34742**. A deeper extension could retest the **200-EMA near 1.33987**, offering potential re-entry for medium-term buyers.
* **Scenario B — Bullish Breakout Continuation:** A decisive daily candle close above **1.36353** invalidates the bearish retracement thesis, opening a clean upside path toward major swing high resistance at **1.38594**.
### 📊 Tactical Parameters Summary:
* **Current Bias:** Neutral / Short-Term Pullback Risk
* **Primary Overhead Resistance Zone:** 1.35522 – 1.36353
* **Macro Peak Target (Scenario B Breakout):** 1.38594
* **Immediate Dynamic Support (17-EMA):** 1.34742
* **Institutional Macro Anchor (200-EMA):** 1.33987
* **Major Structural Confluence Floor:** 1.31431 / 1.30184
---
📊 **ChartPro Data**
*FX Market Architecture, Structural Supply/Demand & Systematic Risk Management.*
⚠️ **Disclaimer:** For educational and informational purposes only. This active market study represents a personal trading framework and does not constitute financial or investment advice.

免責聲明
這些資訊和出版物並非旨在提供,也不構成TradingView提供或認可的任何形式的財務、投資、交易或其他類型的建議或推薦。請閱讀使用條款以了解更多資訊。
免責聲明
這些資訊和出版物並非旨在提供,也不構成TradingView提供或認可的任何形式的財務、投資、交易或其他類型的建議或推薦。請閱讀使用條款以了解更多資訊。