

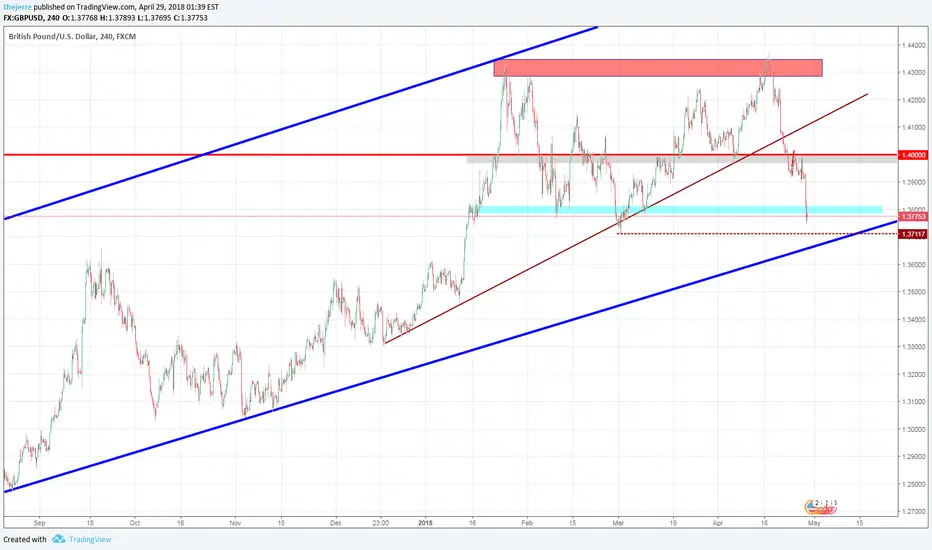
During the second week of Bear action, we saw a break of the psychological level of 1.40000.
With 2 re-tests offering opportunity for traders to load shorts. An impressive move lower pushed this pair towards the March low.
With the bearish move in full force we could see a move lower towards the 2017 Bullish trendline, which could be offering support and possibly a reversal.
A number of confluences in this area, the 50% retracement of the last major Bullish move. It also is the latest higher low in the referred Bullish (2017) channel,
Weekly chart with the Fibonacci level, see the perfect alignment with the Bullish trendline and the March Low;

We also have the PMI numbers upcoming for this week, which should guarantee some good price action.
Interesting stuff makes for interesting week!
Stay green all!
With 2 re-tests offering opportunity for traders to load shorts. An impressive move lower pushed this pair towards the March low.
With the bearish move in full force we could see a move lower towards the 2017 Bullish trendline, which could be offering support and possibly a reversal.
A number of confluences in this area, the 50% retracement of the last major Bullish move. It also is the latest higher low in the referred Bullish (2017) channel,
Weekly chart with the Fibonacci level, see the perfect alignment with the Bullish trendline and the March Low;
We also have the PMI numbers upcoming for this week, which should guarantee some good price action.
Interesting stuff makes for interesting week!
Stay green all!
註釋
we have a very interesting scenario playing out, a double bottom on the H4 chart appeared, which could spark a reversal. I've missed it today, i will be looking for a retest of the daily low (that said; when the daily low stays as is..) For a entry, my Stoploss will be below the Trendline.. Small risk, high profit potential! Stay safe all:)

免責聲明
這些資訊和出版物並非旨在提供,也不構成TradingView提供或認可的任何形式的財務、投資、交易或其他類型的建議或推薦。請閱讀使用條款以了解更多資訊。
免責聲明
這些資訊和出版物並非旨在提供,也不構成TradingView提供或認可的任何形式的財務、投資、交易或其他類型的建議或推薦。請閱讀使用條款以了解更多資訊。