

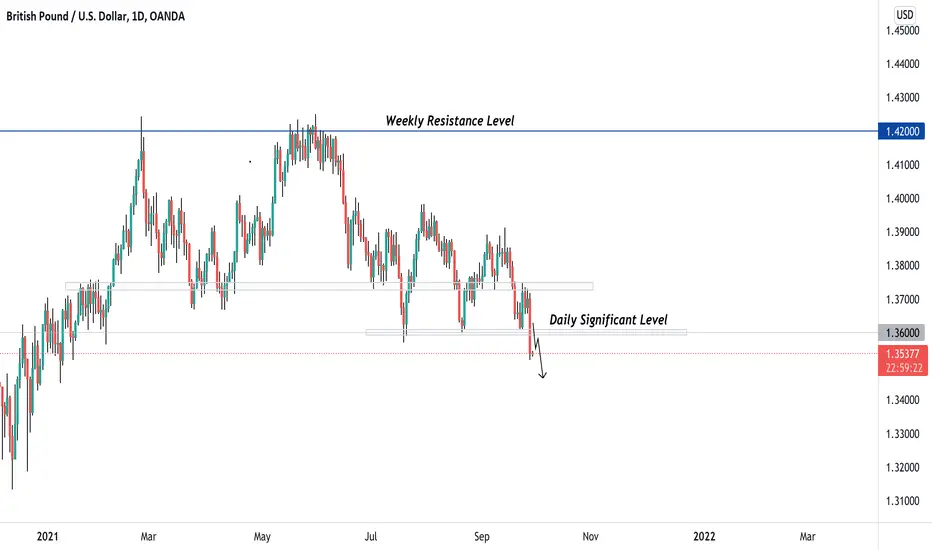
The market structure on GbpUsd seems to be shifting from a bullish to bearish sentiment on the daily timeframe. Ever since price has approached the Weekly Resistance Level, sellers have made themselves more apparent and clear downtrend structure has been established.
Scoping into the 4H charts, the most recent bearish candle has aggressively broke through the Daily Significant Level. This break in support could potentially indicate bearish strength, adding to the long-term bias as well. If we could retest this level as potential resistance and follow with strong bearish rejection, I'll be looking for sell opportunities.

免責聲明
這些資訊和出版物並非旨在提供,也不構成TradingView提供或認可的任何形式的財務、投資、交易或其他類型的建議或推薦。請閱讀使用條款以了解更多資訊。
免責聲明
這些資訊和出版物並非旨在提供,也不構成TradingView提供或認可的任何形式的財務、投資、交易或其他類型的建議或推薦。請閱讀使用條款以了解更多資訊。