

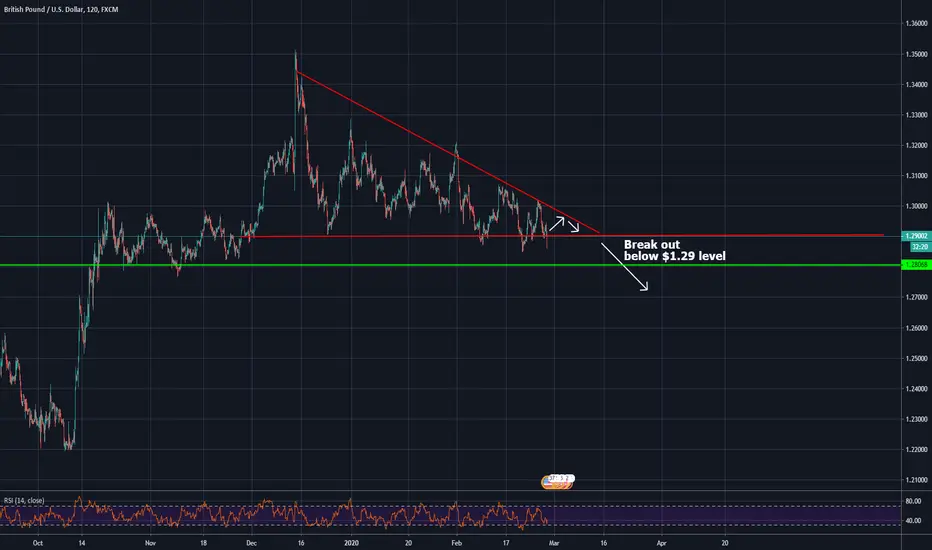
Descending triangle on the GBP/USD:
- Price keeps bouncing off $1.29 support level (red horizontal line)
- 1-hour chart clearly shows a perfect example of a descending triangle, getting narrower between the upper downwards trend line and the major $1.29 support level
- Given a situation where Brexit trade talks fail and tensions rise even more between London and Brussels, then eventually we could see a breakout below the $1.29 level at the end of the descending triangle
- However, if Bernie Sanders keeps dominating in the US, then things might go quite differently. Though indication of a bearish pattern is strong here.
- If bearish breakout happens, next major support level is $1.28 (green horizontal line)
**Note that I am not responsible for your trading decisions. It is solely your responsibility to make your own decisions ;)
- Price keeps bouncing off $1.29 support level (red horizontal line)
- 1-hour chart clearly shows a perfect example of a descending triangle, getting narrower between the upper downwards trend line and the major $1.29 support level
- Given a situation where Brexit trade talks fail and tensions rise even more between London and Brussels, then eventually we could see a breakout below the $1.29 level at the end of the descending triangle
- However, if Bernie Sanders keeps dominating in the US, then things might go quite differently. Though indication of a bearish pattern is strong here.
- If bearish breakout happens, next major support level is $1.28 (green horizontal line)
**Note that I am not responsible for your trading decisions. It is solely your responsibility to make your own decisions ;)

免責聲明
這些資訊和出版物並非旨在提供,也不構成TradingView提供或認可的任何形式的財務、投資、交易或其他類型的建議或推薦。請閱讀使用條款以了解更多資訊。
免責聲明
這些資訊和出版物並非旨在提供,也不構成TradingView提供或認可的任何形式的財務、投資、交易或其他類型的建議或推薦。請閱讀使用條款以了解更多資訊。