

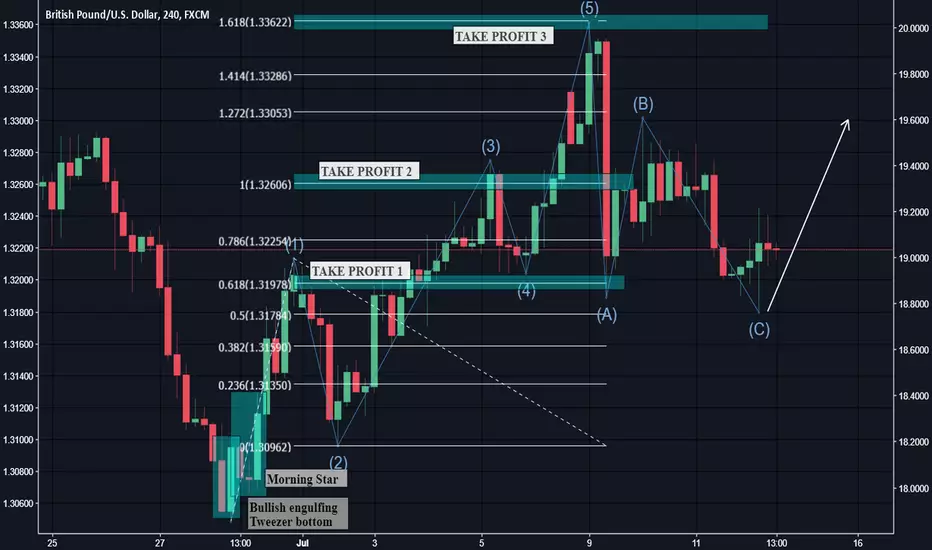
When you see a morning star pattern (you can use candle software to find such), usually it marks the start of Elliott wave 1 to 5 sequence, you enter at the end of the first correction wave (retrace into the body of morning star pattern). When wave 2 is completed, we plot Fibonacci retracements from the tail of Morning star and you will see how perfectly price reaches Fib extension 161.8 (1.336), the end of Elliott wave 5, doing pullbacks at FE 61.8 and FE 100 (1.326). Metatrader´s Fib extension has extensions of 61.8, 100 and 161.8 but thats enough. Now price is doing ABC correction pattern as you see.

免責聲明
這些資訊和出版物並非旨在提供,也不構成TradingView提供或認可的任何形式的財務、投資、交易或其他類型的建議或推薦。請閱讀使用條款以了解更多資訊。