

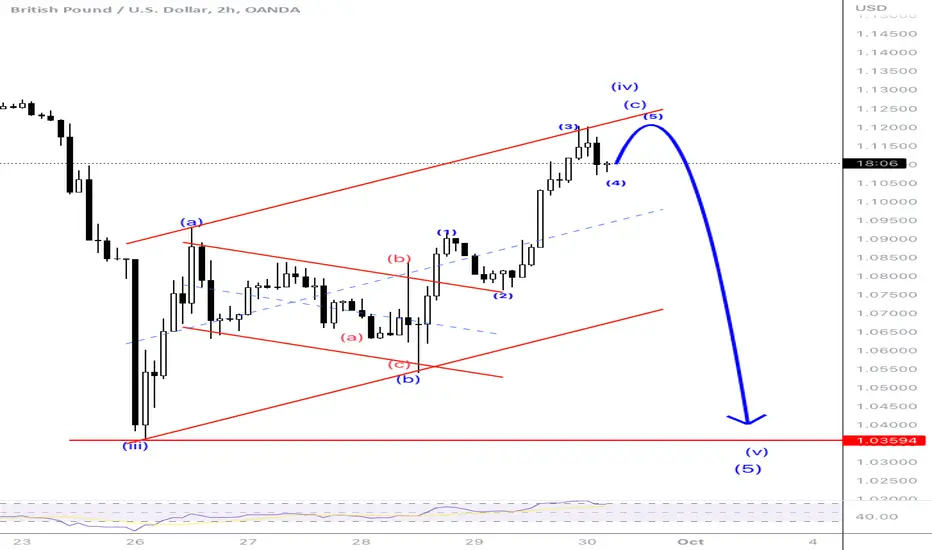
2hr chart outlook of GBPUSD suggests that a corrective structure from the low of 1.036 is in progress as an a- b -c . Wave a rally ended @ 1.09298, followed by a pull back - wave(b) which ended @ 1.05398. it was then followed by wave c rally to the last high of 1.12000. This a-b-c structure is meant to be wave (4) of a bigger time frame count, and Ideally market will resume its falling momentum for wave 5.
a lower timeframe check at the wave (a) subdivisions. We found a 5 wave impulse structure . Wave (c) also consists of subdivisions of wave 1, 2 , 3, 4. We expect a further tilt upside to form wave 5 before it resumes the bearish outlook in the near term.
a lower timeframe check at the wave (a) subdivisions. We found a 5 wave impulse structure . Wave (c) also consists of subdivisions of wave 1, 2 , 3, 4. We expect a further tilt upside to form wave 5 before it resumes the bearish outlook in the near term.

免責聲明
這些資訊和出版物並非旨在提供,也不構成TradingView提供或認可的任何形式的財務、投資、交易或其他類型的建議或推薦。請閱讀使用條款以了解更多資訊。
免責聲明
這些資訊和出版物並非旨在提供,也不構成TradingView提供或認可的任何形式的財務、投資、交易或其他類型的建議或推薦。請閱讀使用條款以了解更多資訊。