

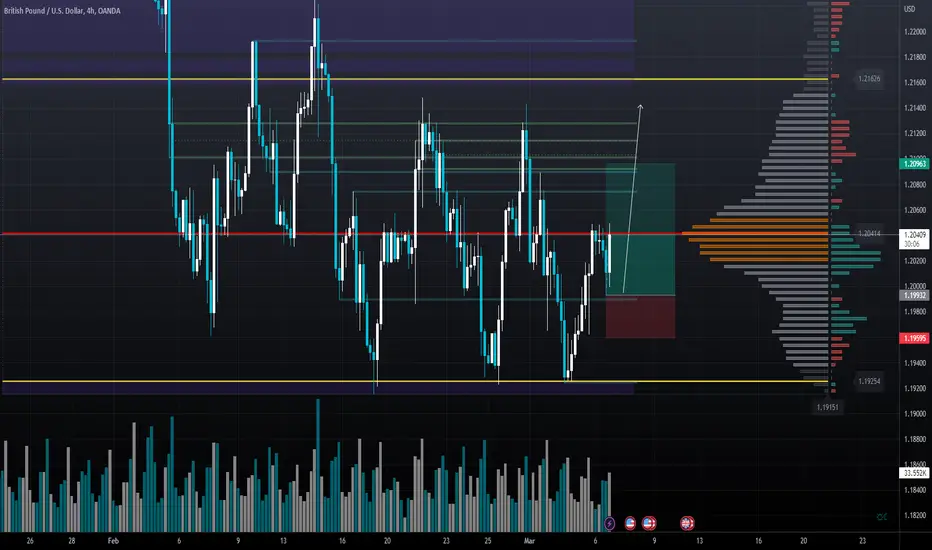
GBP/USD has managed to erase its daily gains after having tested 1.2000 in the European session on Monday. The renewed US Dollar weakness following Wall Street's opening bell helps the pair keep its footing ahead of FOMC Chairman Powell's testimony on Tuesday.
GBP/USD trades near 1.2050, where the 100-period Simple Moving Average (SMA) on the four-hour chart and the Fibonacci 23.6% retracement of the latest downtrend align. Slightly above that level at 1.2080, the descending trend line that sits above the lower-highs that seem to have formed on the four-hour chart forms strong resistance. Only a four-hour close above that level could be seen as a significant bullish development and open the door for an extended rebound to 1.2120 (Fibonacci 38.2% retracement).
On the downside, 1.2000 (psychological level, static level, 100-day SMA) is key support ahead of 1.1970 (static level) and 1.1930 (end-point of the latest downtrend, static level).
GBP/USD trades near 1.2050, where the 100-period Simple Moving Average (SMA) on the four-hour chart and the Fibonacci 23.6% retracement of the latest downtrend align. Slightly above that level at 1.2080, the descending trend line that sits above the lower-highs that seem to have formed on the four-hour chart forms strong resistance. Only a four-hour close above that level could be seen as a significant bullish development and open the door for an extended rebound to 1.2120 (Fibonacci 38.2% retracement).
On the downside, 1.2000 (psychological level, static level, 100-day SMA) is key support ahead of 1.1970 (static level) and 1.1930 (end-point of the latest downtrend, static level).

相關出版品
免責聲明
這些資訊和出版物並非旨在提供,也不構成TradingView提供或認可的任何形式的財務、投資、交易或其他類型的建議或推薦。請閱讀使用條款以了解更多資訊。