
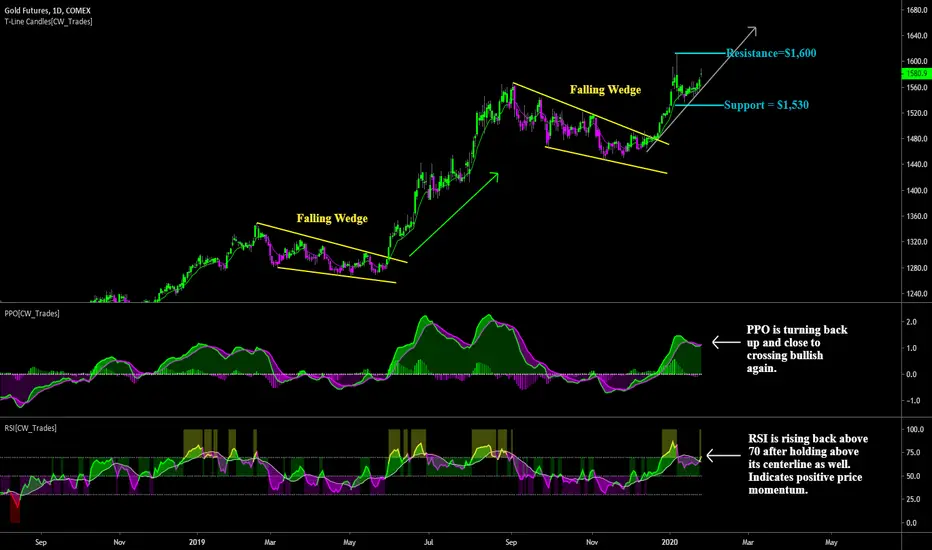
While equities have been putting in a series of bearish rising wedges, gold has two successful falling wedge breakouts on the daily chart and is looking good for a move above short-term resistance at $1,600. Price indicators are both showing a bullish trend and momentum behind price with a new advance likely coming this week. Main thing we want to see on any potential pullback is a hold above the gray arrow which represents the current support level of the uptrend. Secondary support is $1,500, price remaining above that level and bouncing again would be considered a bullish retest; a break below $1,500 would give reason for shorting.

免責聲明
這些資訊和出版物並非旨在提供,也不構成TradingView提供或認可的任何形式的財務、投資、交易或其他類型的建議或推薦。請閱讀使用條款以了解更多資訊。
免責聲明
這些資訊和出版物並非旨在提供,也不構成TradingView提供或認可的任何形式的財務、投資、交易或其他類型的建議或推薦。請閱讀使用條款以了解更多資訊。