
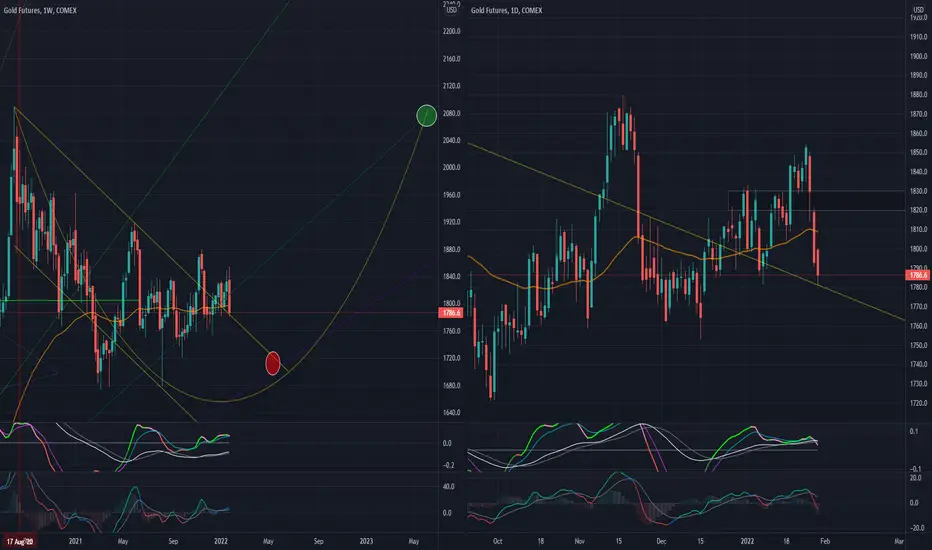
Ever since August 2020, Gold has been acting odd. It has been ranging in a rather large range, and somewhat random IMHO.
The week ended strongly down with an engulfing candlestick that covered a six week range, ending at the lower end of the range with a lower low. This is a rather bearish indication IMHO.
The daily chart showed this near term bearish with a gap down and long bearish candles.
Oddly... appears that the adjusted downside target is 1700-1720; with a longer term upside back to 2000.
Just be wary... I am.
The week ended strongly down with an engulfing candlestick that covered a six week range, ending at the lower end of the range with a lower low. This is a rather bearish indication IMHO.
The daily chart showed this near term bearish with a gap down and long bearish candles.
Oddly... appears that the adjusted downside target is 1700-1720; with a longer term upside back to 2000.
Just be wary... I am.

相關出版品
免責聲明
這些資訊和出版物並非旨在提供,也不構成TradingView提供或認可的任何形式的財務、投資、交易或其他類型的建議或推薦。請閱讀使用條款以了解更多資訊。