
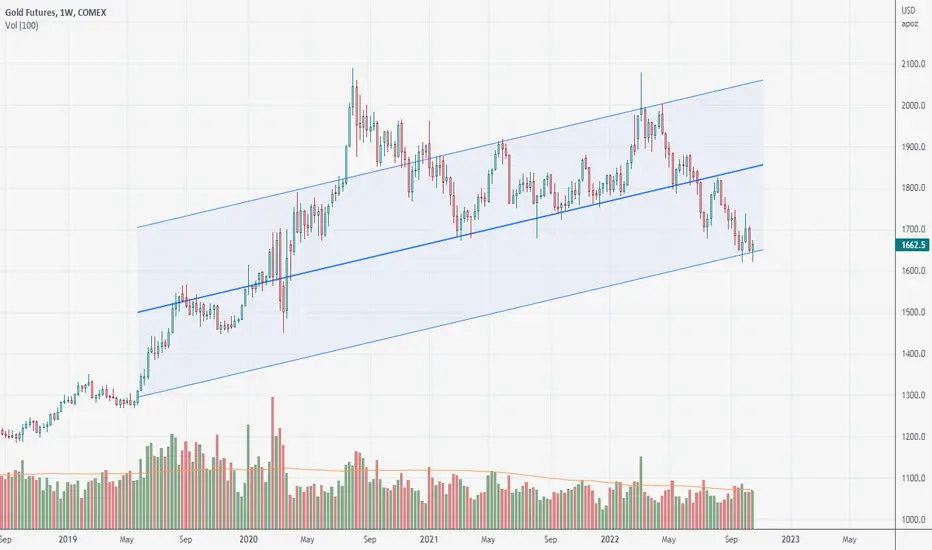
1660 looks like the serious support, as could be expected. Because it coincides with the bottom line of the long term trend channel (blue).
The volumes & candles show 2 times that supply exhausts around 1660, and demand demonstrates strength (Bullish Cha Cha signal).
So, the bullish intentions could be read from this chart.
The volumes & candles show 2 times that supply exhausts around 1660, and demand demonstrates strength (Bullish Cha Cha signal).
So, the bullish intentions could be read from this chart.

Supply And Demand Trading .com
免責聲明
這些資訊和出版物並非旨在提供,也不構成TradingView提供或認可的任何形式的財務、投資、交易或其他類型的建議或推薦。請閱讀使用條款以了解更多資訊。
Supply And Demand Trading .com
免責聲明
這些資訊和出版物並非旨在提供,也不構成TradingView提供或認可的任何形式的財務、投資、交易或其他類型的建議或推薦。請閱讀使用條款以了解更多資訊。