
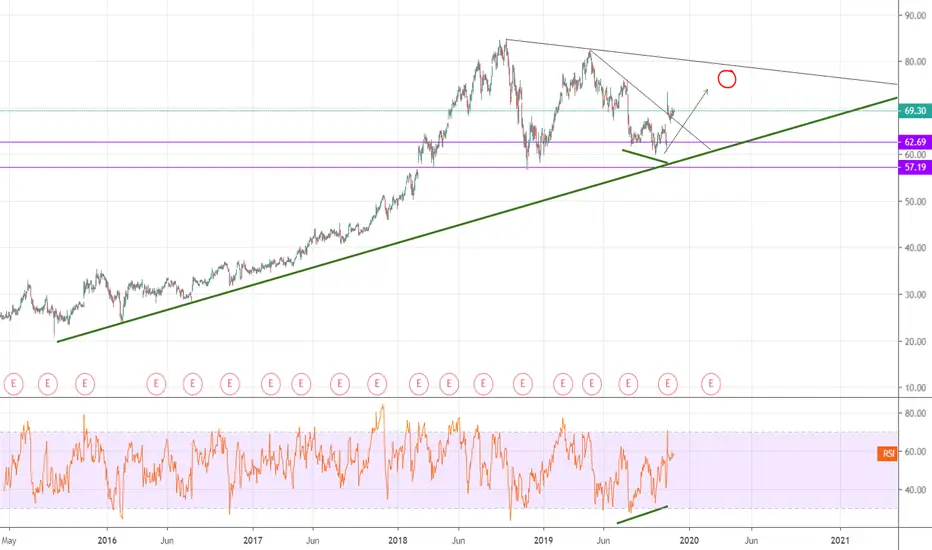
On the 1 day chart we see a Bullish Divergence appear generally indicating a reversal alongside a broken trendline, as GoDaddy announced stronger than expected financials Q3. Average analyst target price is reading $89 for 12 months. Expect resistance around $75
註釋
Awaiting signal form Moving Averages, price has jumped above MA 200 line. Price may bounce off blue 13MA line, which would be short term support and could lead to another bullish signal, which we may see 'Golden Cross' signal when the gold 50MA crosses over the red 100MA.
交易結束:目標達成

免責聲明
這些資訊和出版物並非旨在提供,也不構成TradingView提供或認可的任何形式的財務、投資、交易或其他類型的建議或推薦。請閱讀使用條款以了解更多資訊。