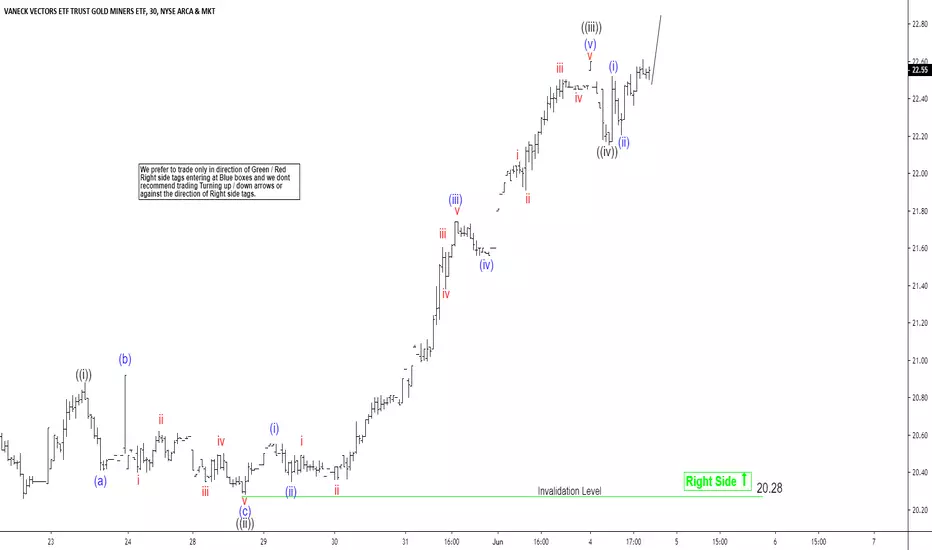
Elliott wave view in Gold Miners ETF ( GDX) suggests the pullback to $20.26 ended wave (2). Wave (3) is currently in progress and the internal subdivides as an impulse Elliott Wave structure. Up from $20.26, Wave ((i)) ended at $20.88, wave ((ii)) ended at $20.31 and wave ((iii)) ended at 22.60 peak and wave ((iv)) ended also at 22.16.
We can see from the chart below the internal of wave ((i)) and ((iii)) also subdivide as an impulse in lesser degree. We don't like sellingGDX and expect buyers to appear in 3, 7, or 11 swing as far as pivot at $20.28 low stays intact. In larger time frame, if GDX can break above Feb 21 peak ($23.70), then it should create a bullish sequence from Sept 11, 2018 low opening up more upside.
GDX) suggests the pullback to $20.26 ended wave (2). Wave (3) is currently in progress and the internal subdivides as an impulse Elliott Wave structure. Up from $20.26, Wave ((i)) ended at $20.88, wave ((ii)) ended at $20.31 and wave ((iii)) ended at 22.60 peak and wave ((iv)) ended also at 22.16. We can see from the chart below the internal of wave ((i)) and ((iii)) also subdivide as an impulse in lesser degree. We don't like selling
GDX and expect buyers to appear in 3, 7, or 11 swing as far as pivot at $20.28 low stays intact. In larger time frame, if GDX can break above Feb 21 peak ($23.70), then it should create a bullish sequence from Sept 11, 2018 low opening up more upside.
14 days trial --> elliottwave-forecast.com/plan-trial/ and get Accurate & timely Elliott Wave Forecasts of 78 instruments. Webinars, Chat Room, Stocks/Forex/Indices Signals & more.
免責聲明
這些資訊和出版物並非旨在提供,也不構成TradingView提供或認可的任何形式的財務、投資、交易或其他類型的建議或推薦。請閱讀使用條款以了解更多資訊。
14 days trial --> elliottwave-forecast.com/plan-trial/ and get Accurate & timely Elliott Wave Forecasts of 78 instruments. Webinars, Chat Room, Stocks/Forex/Indices Signals & more.
免責聲明
這些資訊和出版物並非旨在提供,也不構成TradingView提供或認可的任何形式的財務、投資、交易或其他類型的建議或推薦。請閱讀使用條款以了解更多資訊。