
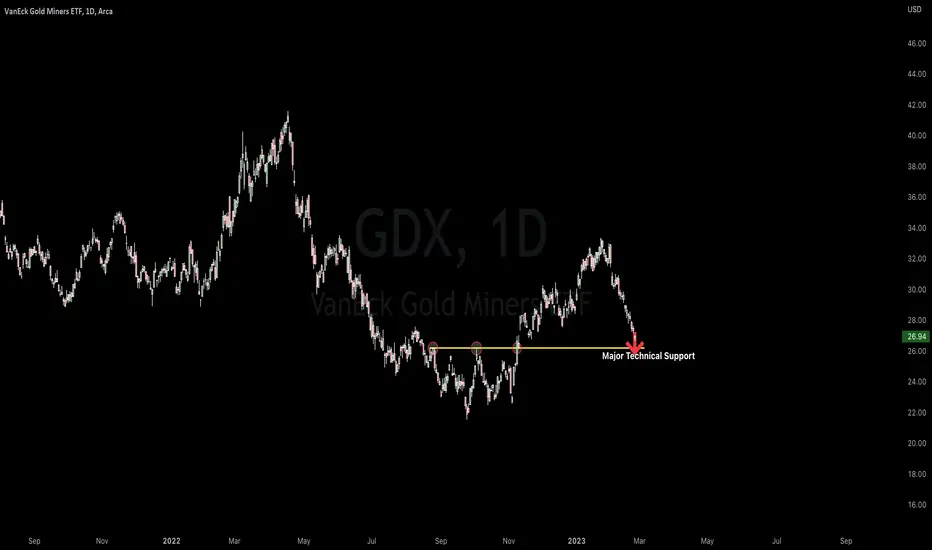
Here we are looking at GDX on the Daily TF…
This analysis will be fairly brief, as the chart is crystal clear as of right now. Here you can see that GDX has retraced since its most recent uptrend which began in November of 2022. Currently, I am expect GDX to bounce off of the strong technical support as marked by the horizontal line (yellow).
This outlined support line hasn’t been re-tested since its break out from it (as previous resistance) which led to its run up as previously mentioned. Now, we can expect GDX to attempt to bounce from this line, and turn this previous resistance into newfound support.
It’s as simple as that…
Let me know what you think BTC is going to do next in the comments!
Cheers!!
This analysis will be fairly brief, as the chart is crystal clear as of right now. Here you can see that GDX has retraced since its most recent uptrend which began in November of 2022. Currently, I am expect GDX to bounce off of the strong technical support as marked by the horizontal line (yellow).
This outlined support line hasn’t been re-tested since its break out from it (as previous resistance) which led to its run up as previously mentioned. Now, we can expect GDX to attempt to bounce from this line, and turn this previous resistance into newfound support.
It’s as simple as that…
Let me know what you think BTC is going to do next in the comments!
Cheers!!

Get trade alerts with exact entries and exits + daily videos with deep dive technical analysis on stocks, crypto, commodities and options. Find these at VerifiedInvesting.com
免責聲明
這些資訊和出版物並非旨在提供,也不構成TradingView提供或認可的任何形式的財務、投資、交易或其他類型的建議或推薦。請閱讀使用條款以了解更多資訊。
Get trade alerts with exact entries and exits + daily videos with deep dive technical analysis on stocks, crypto, commodities and options. Find these at VerifiedInvesting.com
免責聲明
這些資訊和出版物並非旨在提供,也不構成TradingView提供或認可的任何形式的財務、投資、交易或其他類型的建議或推薦。請閱讀使用條款以了解更多資訊。