
Haven't touched stocks or ETFs for a while and now I decide to get back to my favorable Gold stock analysis.
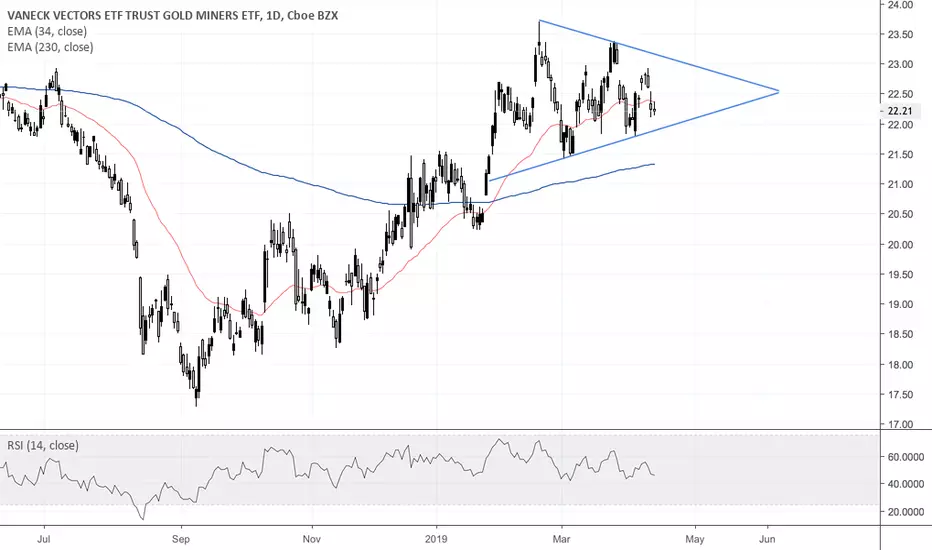
We can easily spot that flag on 4H or Daily chart of GDX, normally with previous bullish price action, gold has slightly more chances on breaking the top side of the triangle.
But!! When I zoomed out to weekly, it tells me a different story. GDX was unable to break the resistance, and I'm thinking that we are on a beginning of a small bear. And I'll post the screenshot below.
I'll keep this post as long as I can and I may consider to enter a trade once there's a breakout on the triangle.
We can easily spot that flag on 4H or Daily chart of GDX, normally with previous bullish price action, gold has slightly more chances on breaking the top side of the triangle.
But!! When I zoomed out to weekly, it tells me a different story. GDX was unable to break the resistance, and I'm thinking that we are on a beginning of a small bear. And I'll post the screenshot below.
I'll keep this post as long as I can and I may consider to enter a trade once there's a breakout on the triangle.
註釋
註釋
註釋
Support Broke, so nice target will be here?註釋
many failed attempt, daily still have hopes on breakout, even though miner tells different story

免責聲明
這些資訊和出版物並非旨在提供,也不構成TradingView提供或認可的任何形式的財務、投資、交易或其他類型的建議或推薦。請閱讀使用條款以了解更多資訊。