
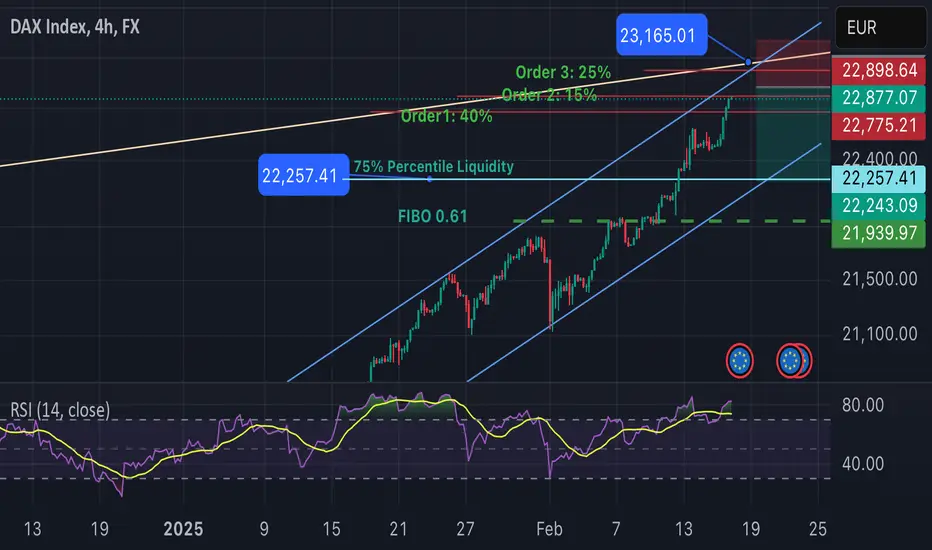
. Trend Lines and Moving Averages:
• Moving Averages (MA): Check the 50-day and 200-day moving averages. DAX is trading above these averages and the 50-day is above the 200-day, that generally indicates an upward trend. A crossover (where the 50-day falls below the 200-day) might suggest a shift to a bearish trend. Stay tuned!!
• Trend Lines: Draw trend lines connecting recent highs & lows. An upward-sloping trend line suggests bullish momentum, Which, in reality triggers an alarm for shortterm buyers to start selling and waiting for a pull back to buy cheaper by waiting downward-sloping bearish pressure.
2. Relative Strength Index (RSI):
• An RSI above 70 typically indicates that the asset might be overbought, suggesting a possible pullback or consolidation.

免責聲明
這些資訊和出版物並非旨在提供,也不構成TradingView提供或認可的任何形式的財務、投資、交易或其他類型的建議或推薦。請閱讀使用條款以了解更多資訊。